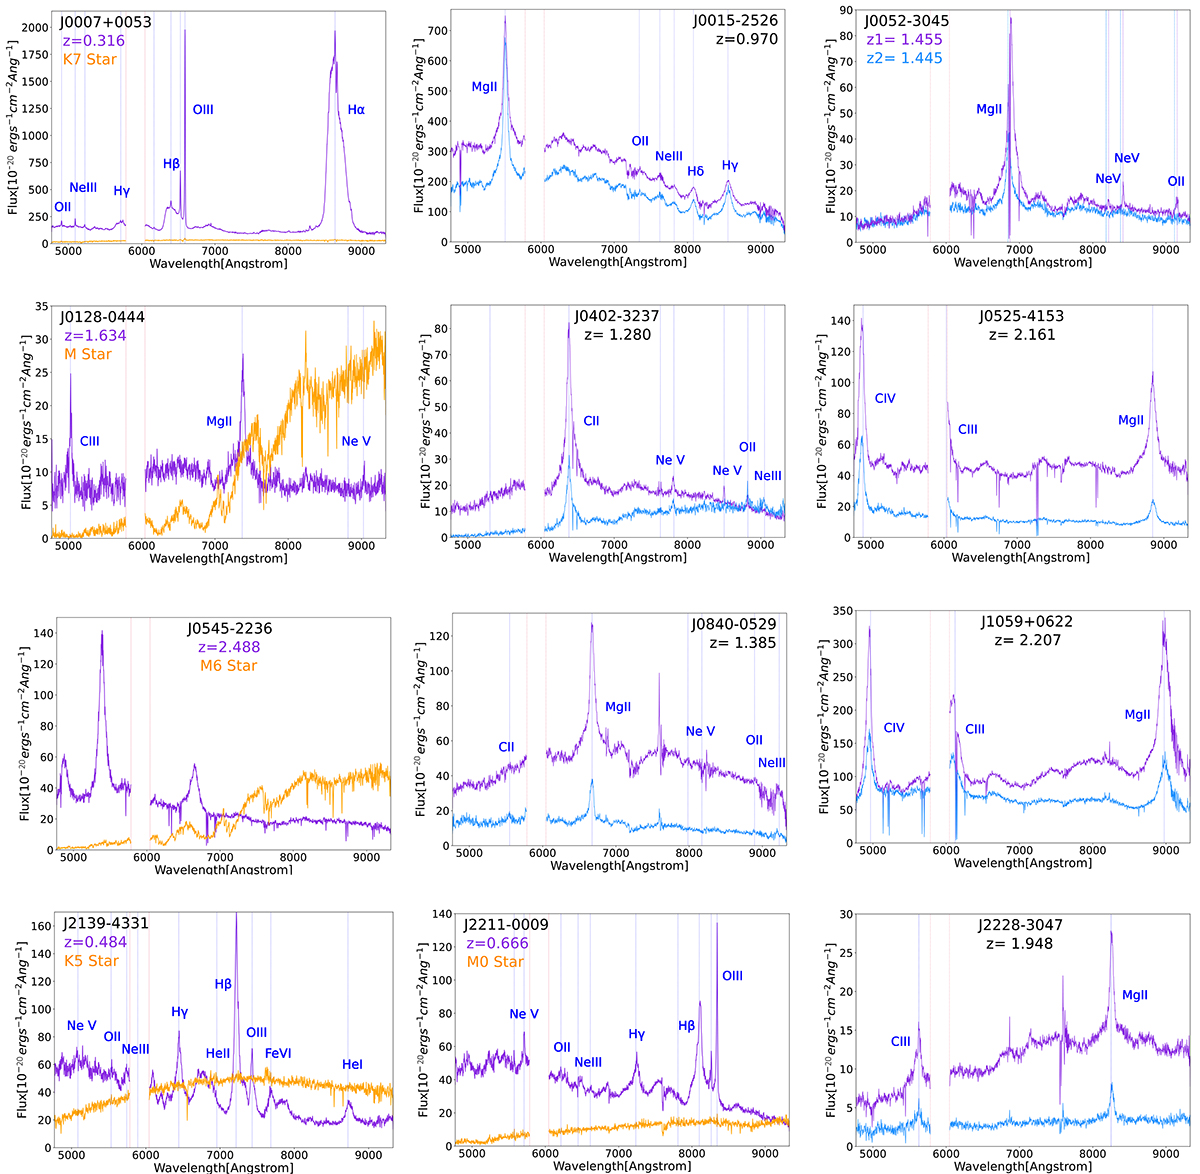
Fig. 2.
Download original image
Spectra of the systems observed with MUSE (target name and redshift are reported in the panels). They have been extracted over the square apertures marked on the white light images in Figure 1 (with the same color-coding). Vertical dotted blue lines mark the position of the main expected emission lines. For J0052−3045, emission lines are plotted in light blue and violet as the redshift for the two AGN is not the same. The star in J0007−0053 has been multiplied by ten to optimize the visualization. The gap around 6000 Å is due to the New Generation Controllers (NGC) deployed in adaptive optics.
Current usage metrics show cumulative count of Article Views (full-text article views including HTML views, PDF and ePub downloads, according to the available data) and Abstracts Views on Vision4Press platform.
Data correspond to usage on the plateform after 2015. The current usage metrics is available 48-96 hours after online publication and is updated daily on week days.
Initial download of the metrics may take a while.