Open Access
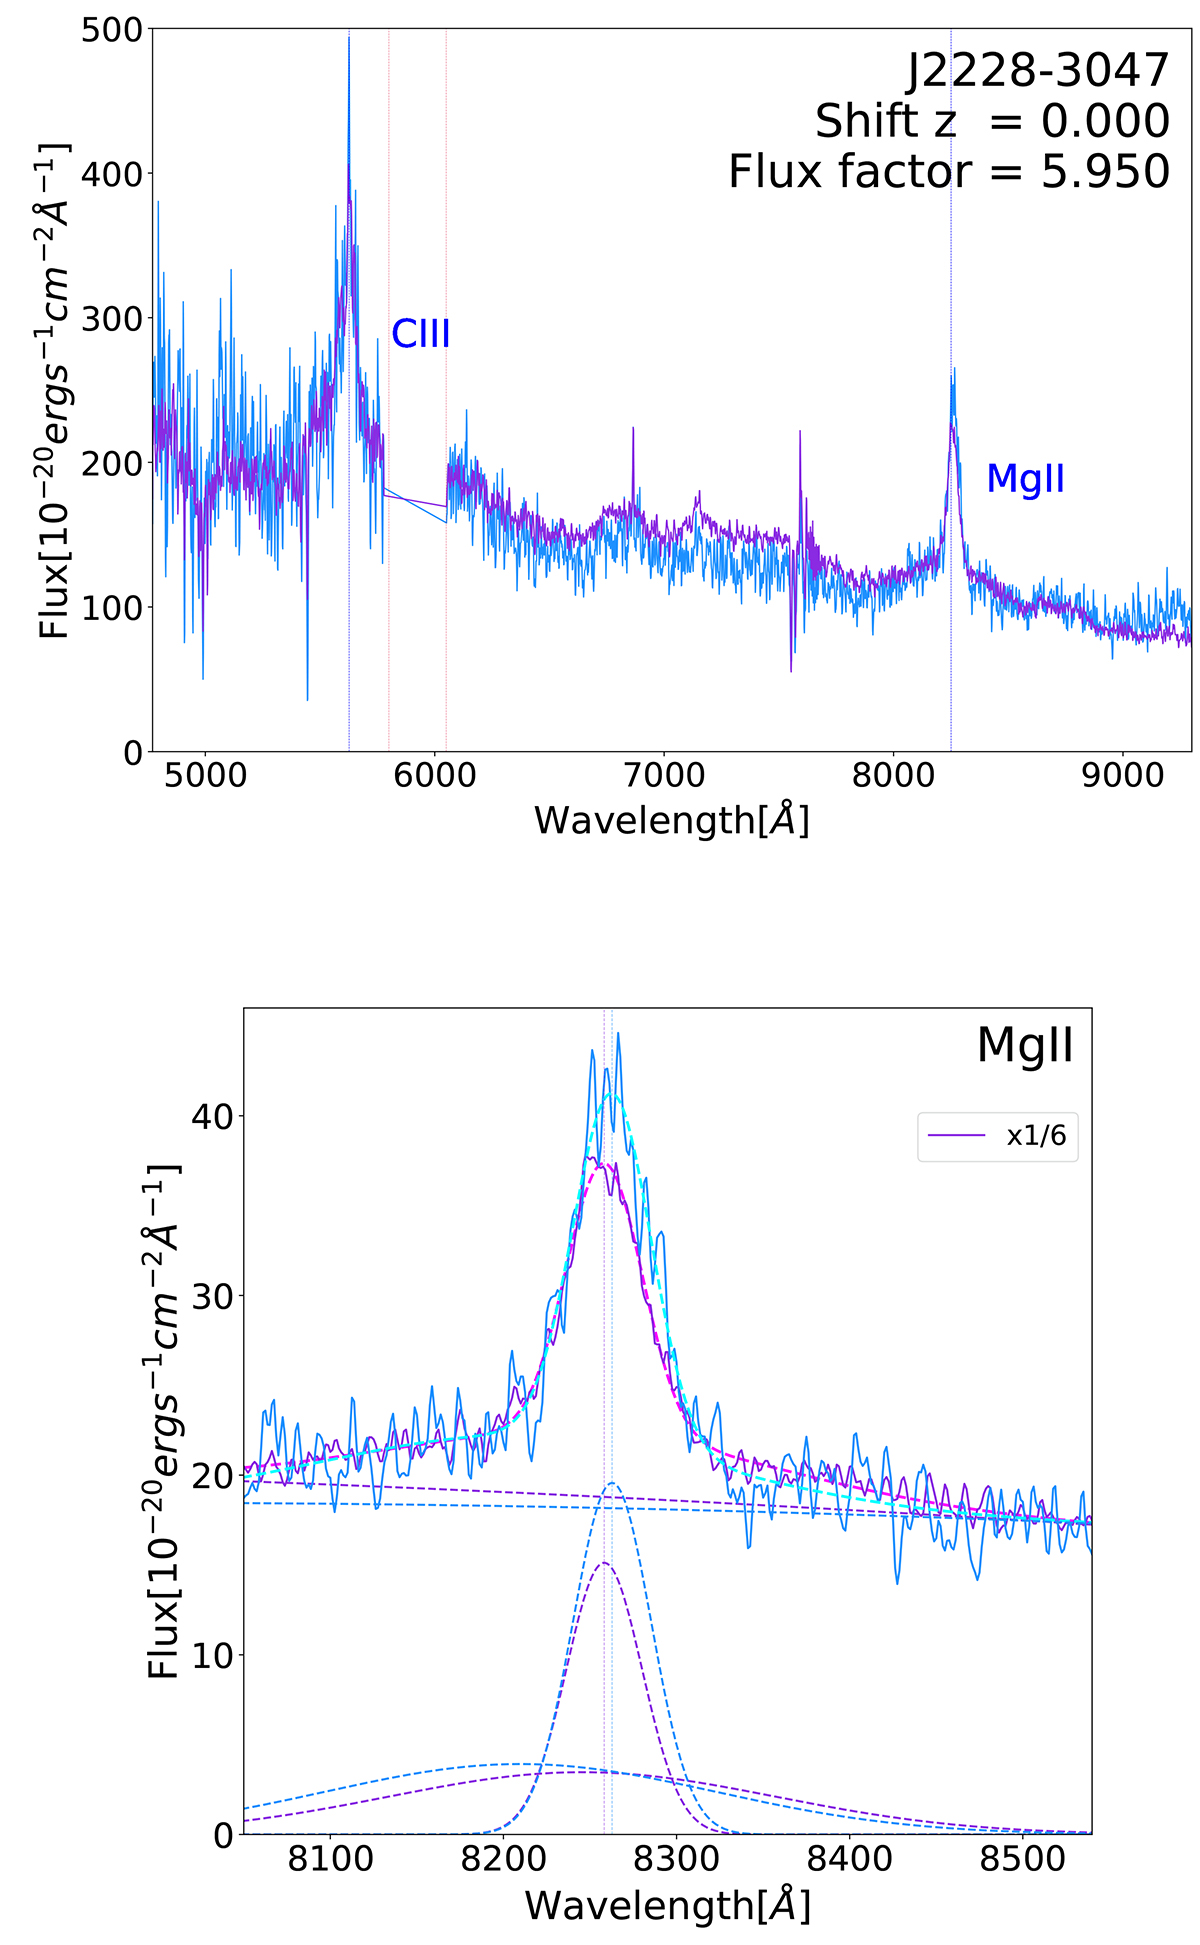
Fig. 10.
Download original image
Upper panel: Cross correlation J2228−3047_B (light blue AGN spectra): multiplied in flux and shifted to the same redshift by the quantities indicated in the labels. Lower panel: Fit to the MgII line of both components of J2228-3047. Color-coding as was in Figure 8.
Current usage metrics show cumulative count of Article Views (full-text article views including HTML views, PDF and ePub downloads, according to the available data) and Abstracts Views on Vision4Press platform.
Data correspond to usage on the plateform after 2015. The current usage metrics is available 48-96 hours after online publication and is updated daily on week days.
Initial download of the metrics may take a while.