Fig. 8
Download original image
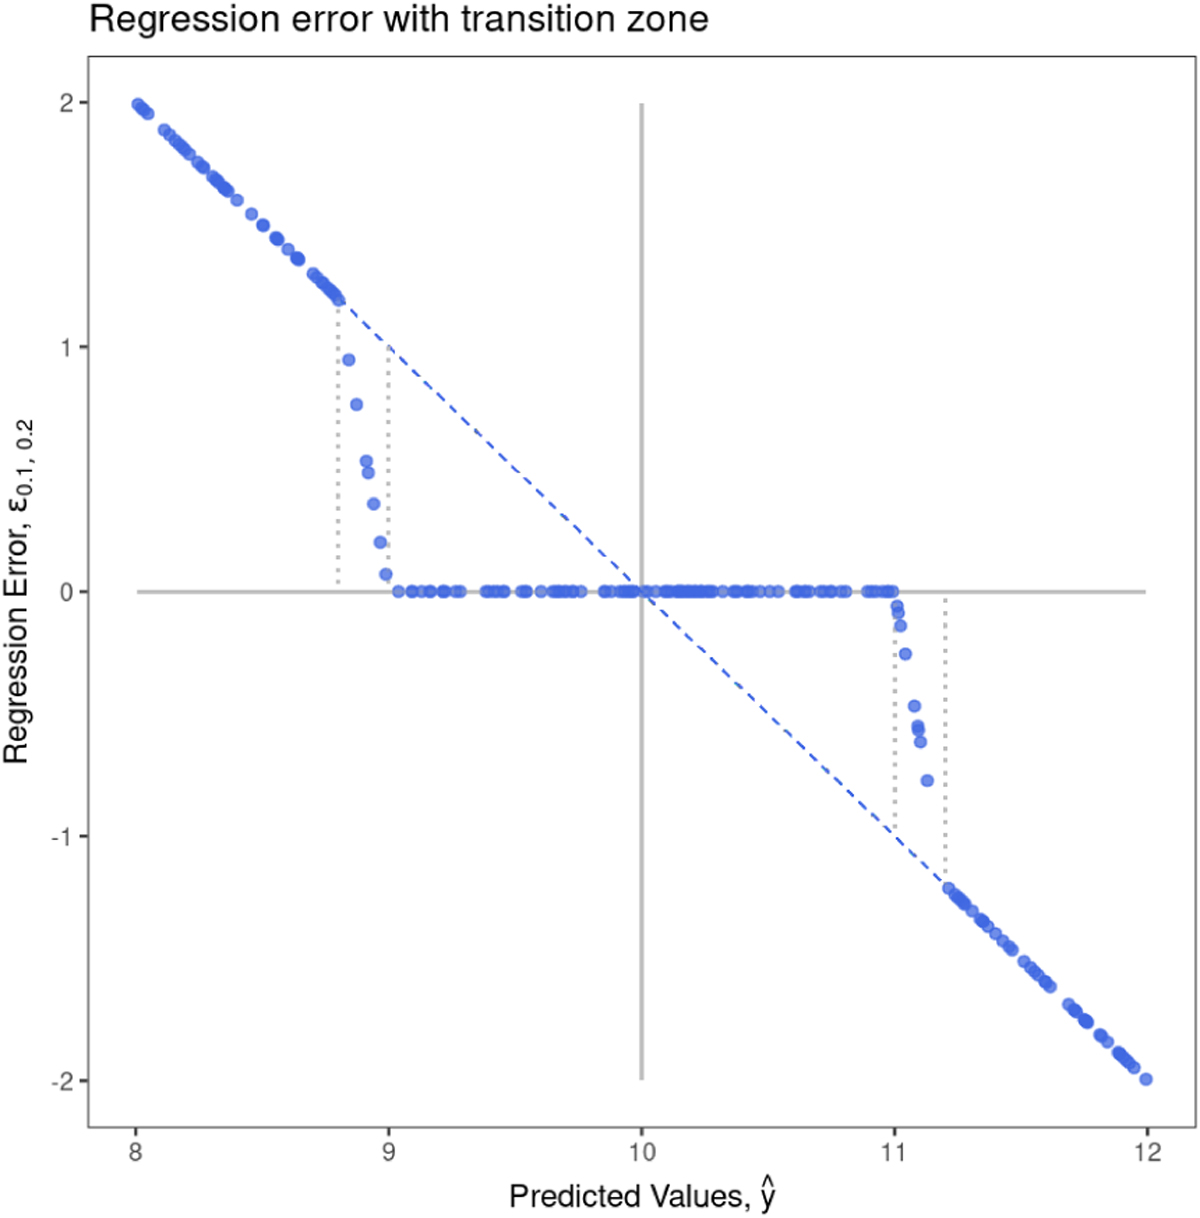
Graphical representation of the interval-based error function computed on simulated data, for a fixed ground truth of 10. The plot shows the 10%-width error function with a transition zone of 20% of the half width of the error-interval. The blue dashed line indicates the residuals and the grey vertical dotted lines indicate the transition zones.
Current usage metrics show cumulative count of Article Views (full-text article views including HTML views, PDF and ePub downloads, according to the available data) and Abstracts Views on Vision4Press platform.
Data correspond to usage on the plateform after 2015. The current usage metrics is available 48-96 hours after online publication and is updated daily on week days.
Initial download of the metrics may take a while.