Open Access
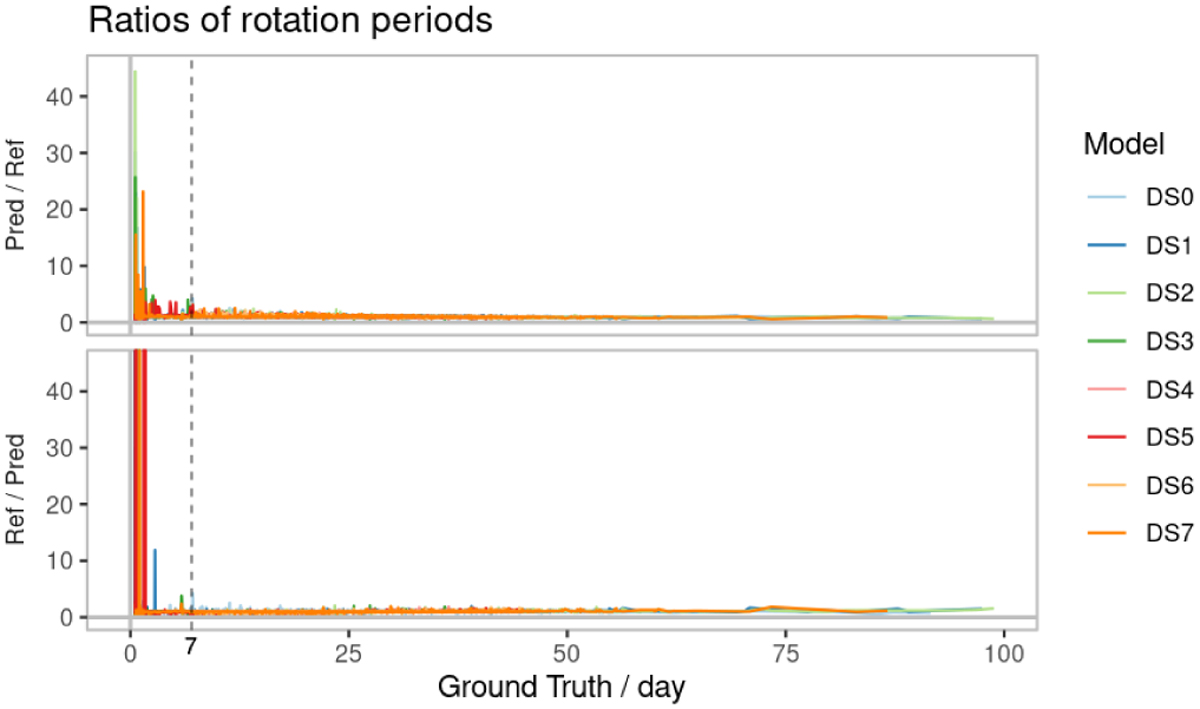
Fig. 13
Download original image
Predictions over the ground truth (top panel) and its inverse (bottom panel) for the models obtained in iteration 2. The top plot highlights the magnitude of over-predictions, while the bottom plot highlights the amplitude of under-predictions.
Current usage metrics show cumulative count of Article Views (full-text article views including HTML views, PDF and ePub downloads, according to the available data) and Abstracts Views on Vision4Press platform.
Data correspond to usage on the plateform after 2015. The current usage metrics is available 48-96 hours after online publication and is updated daily on week days.
Initial download of the metrics may take a while.