Fig. 12
Download original image
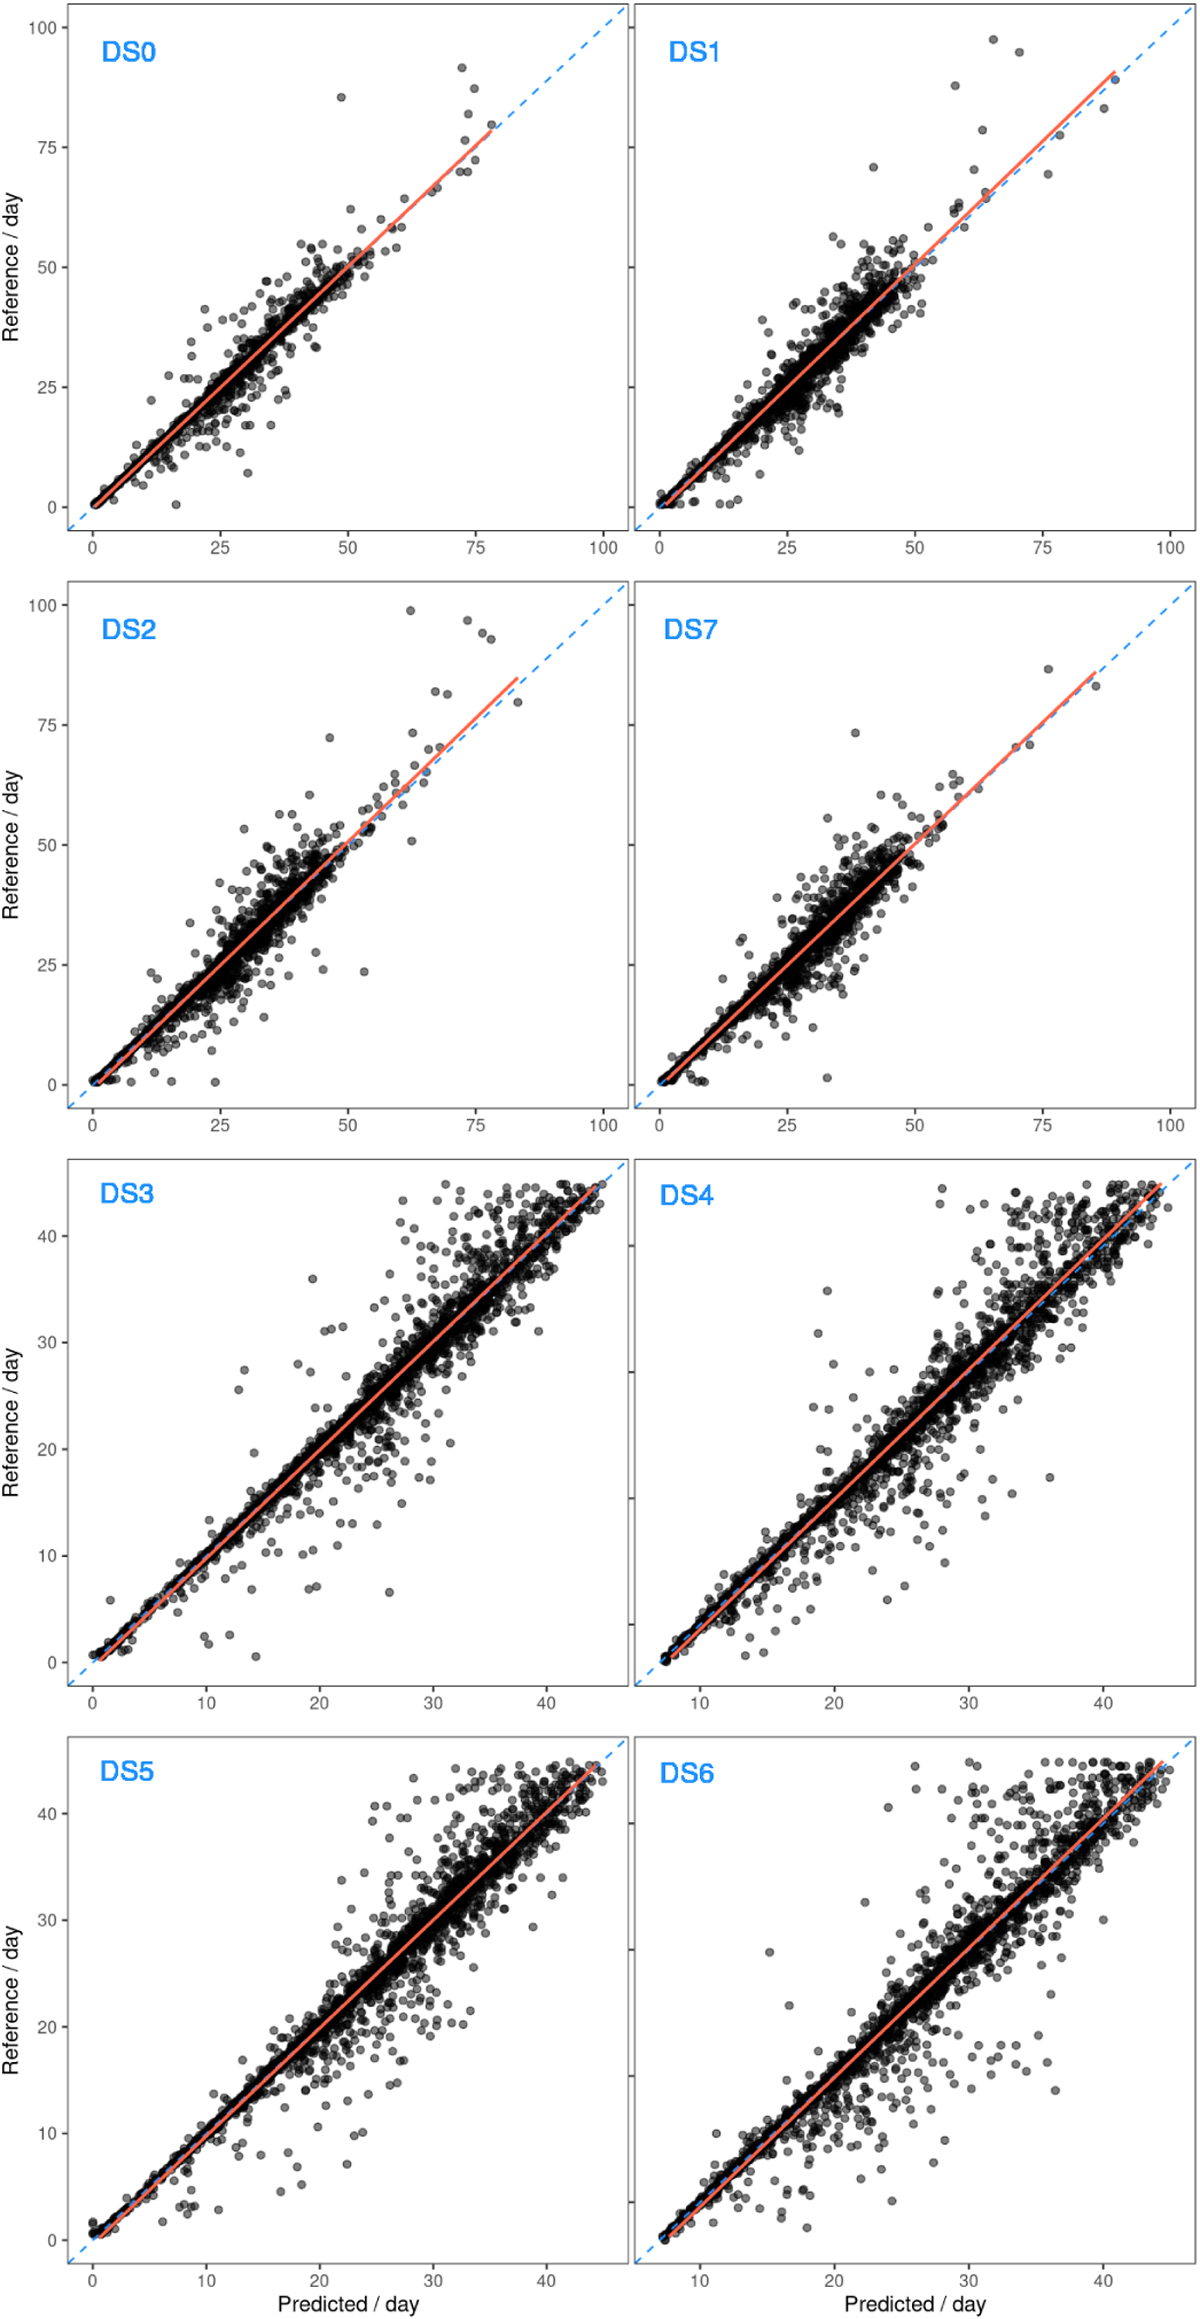
Scatter plots of the reference rotation period as a function of the predicted values for the models built in iteration 2. The blue dashed lines indicate the identity function and the red solid lines represent the linear model between the ground truth and the predictions. DS7 has been placed next to DS1 and DS2 to facilitate model comparisons.
Current usage metrics show cumulative count of Article Views (full-text article views including HTML views, PDF and ePub downloads, according to the available data) and Abstracts Views on Vision4Press platform.
Data correspond to usage on the plateform after 2015. The current usage metrics is available 48-96 hours after online publication and is updated daily on week days.
Initial download of the metrics may take a while.