Fig. 11
Download original image
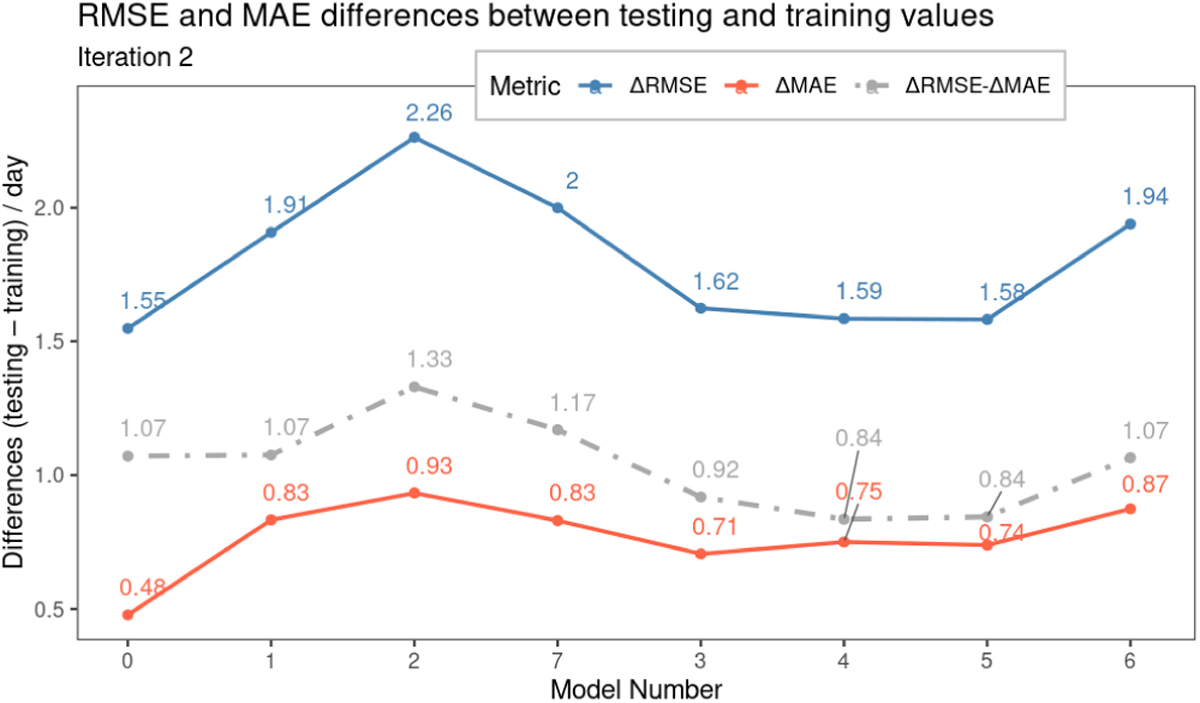
RMSE and MAE differences, respectively: the ∆RMSE (blue thick line) and ∆MAE (red thin line), between the testing and training sets for the models generated in iteration 2. For both the RMSE and MAE, the differences are highest at DS2 and lowest at DS0. The dot-dashed grey line indicates ∆RMSE – ∆MAE, which is maximum at DS2 and minimum at DS4 and DS5.
Current usage metrics show cumulative count of Article Views (full-text article views including HTML views, PDF and ePub downloads, according to the available data) and Abstracts Views on Vision4Press platform.
Data correspond to usage on the plateform after 2015. The current usage metrics is available 48-96 hours after online publication and is updated daily on week days.
Initial download of the metrics may take a while.