Fig. 1
Download original image
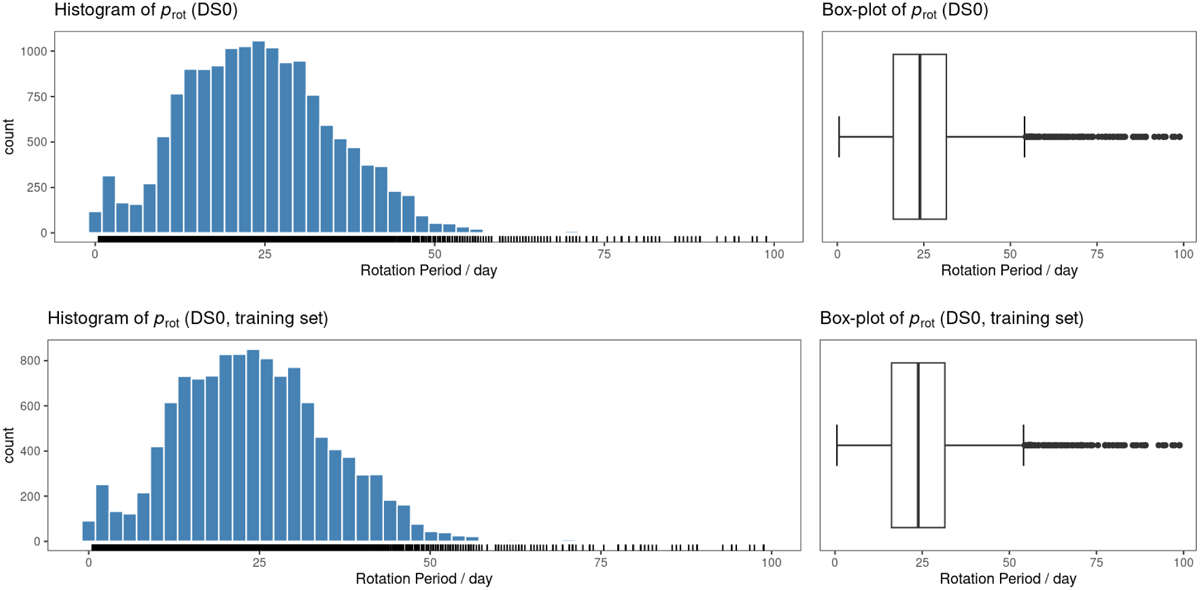
Histograms (left panels) and box-plots (right panels) of the target variable, prot, on DS0 (top row) and on the training set generated from it (bottom row). The distributions are very similar to each other, right skewed, with medians equal to 23.87 d, minima and maxima of 0.53 d and 98.83 d, respectively. Both have several outliers.
Current usage metrics show cumulative count of Article Views (full-text article views including HTML views, PDF and ePub downloads, according to the available data) and Abstracts Views on Vision4Press platform.
Data correspond to usage on the plateform after 2015. The current usage metrics is available 48-96 hours after online publication and is updated daily on week days.
Initial download of the metrics may take a while.