Fig. 6
Download original image
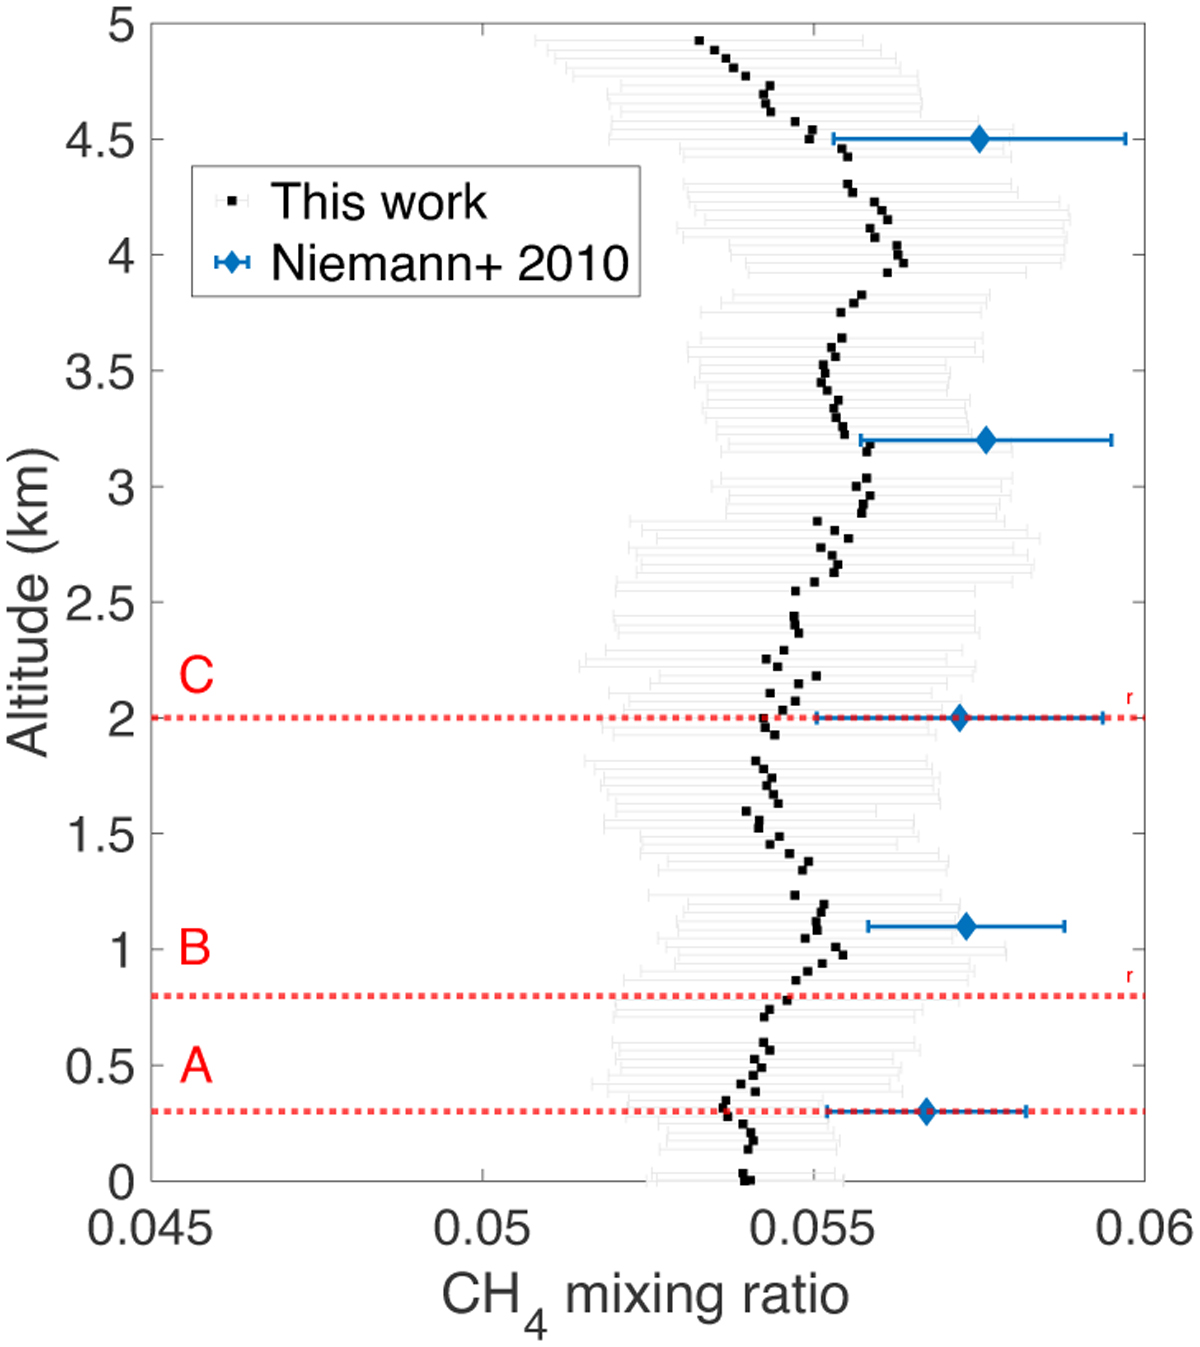
Close up of the high-resolution profile of methane in the lower troposphere below 5 km. Black dots represent our median retrieved values with their associated error bars. Blue diamonds and bars represent methane mixing ratios reported by Niemann et al. (2010) and their standard deviation, respectively. Red horizontal dashed lines labeled A, B, and C represent the altitude of the boundary layers identified in Charnay & Lebonnois (2012) at 300 m, 800 m, and 2 km, respectively.
Current usage metrics show cumulative count of Article Views (full-text article views including HTML views, PDF and ePub downloads, according to the available data) and Abstracts Views on Vision4Press platform.
Data correspond to usage on the plateform after 2015. The current usage metrics is available 48-96 hours after online publication and is updated daily on week days.
Initial download of the metrics may take a while.