Fig. 5
Download original image
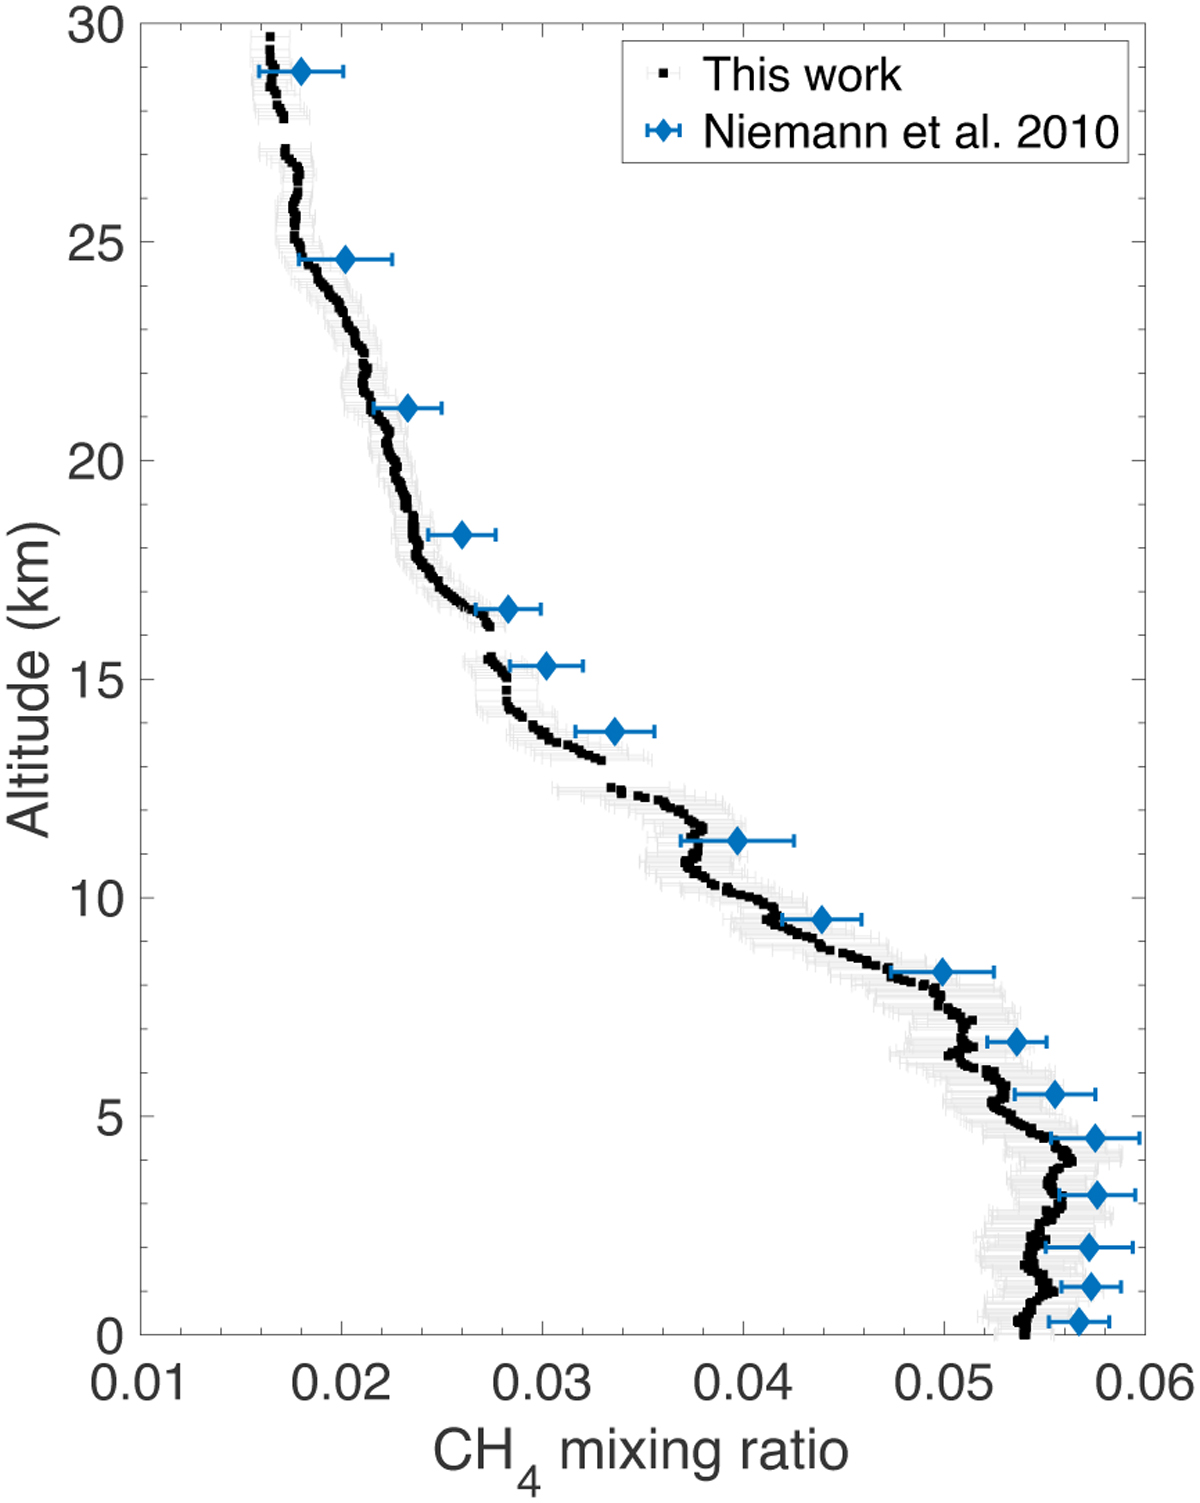
High resolution vertical profile of methane below 30 km. Black dots represent the median of 100 000 deconvolutions and grey bars their 1 − σ deviations. As the main source of uncertainties comes from the seeding fractionation pattern and not the retrieval method, error bars should be understood as systematic errors. This means that for example if a more accurate measurement was to confirm a given value to be lower than the mean reported value here, this would be valid for all the other altitudes as well. Blue diamonds and bars represent methane mixing ratios reported by Niemann et al. (2010) and their standard deviation, respectively.
Current usage metrics show cumulative count of Article Views (full-text article views including HTML views, PDF and ePub downloads, according to the available data) and Abstracts Views on Vision4Press platform.
Data correspond to usage on the plateform after 2015. The current usage metrics is available 48-96 hours after online publication and is updated daily on week days.
Initial download of the metrics may take a while.