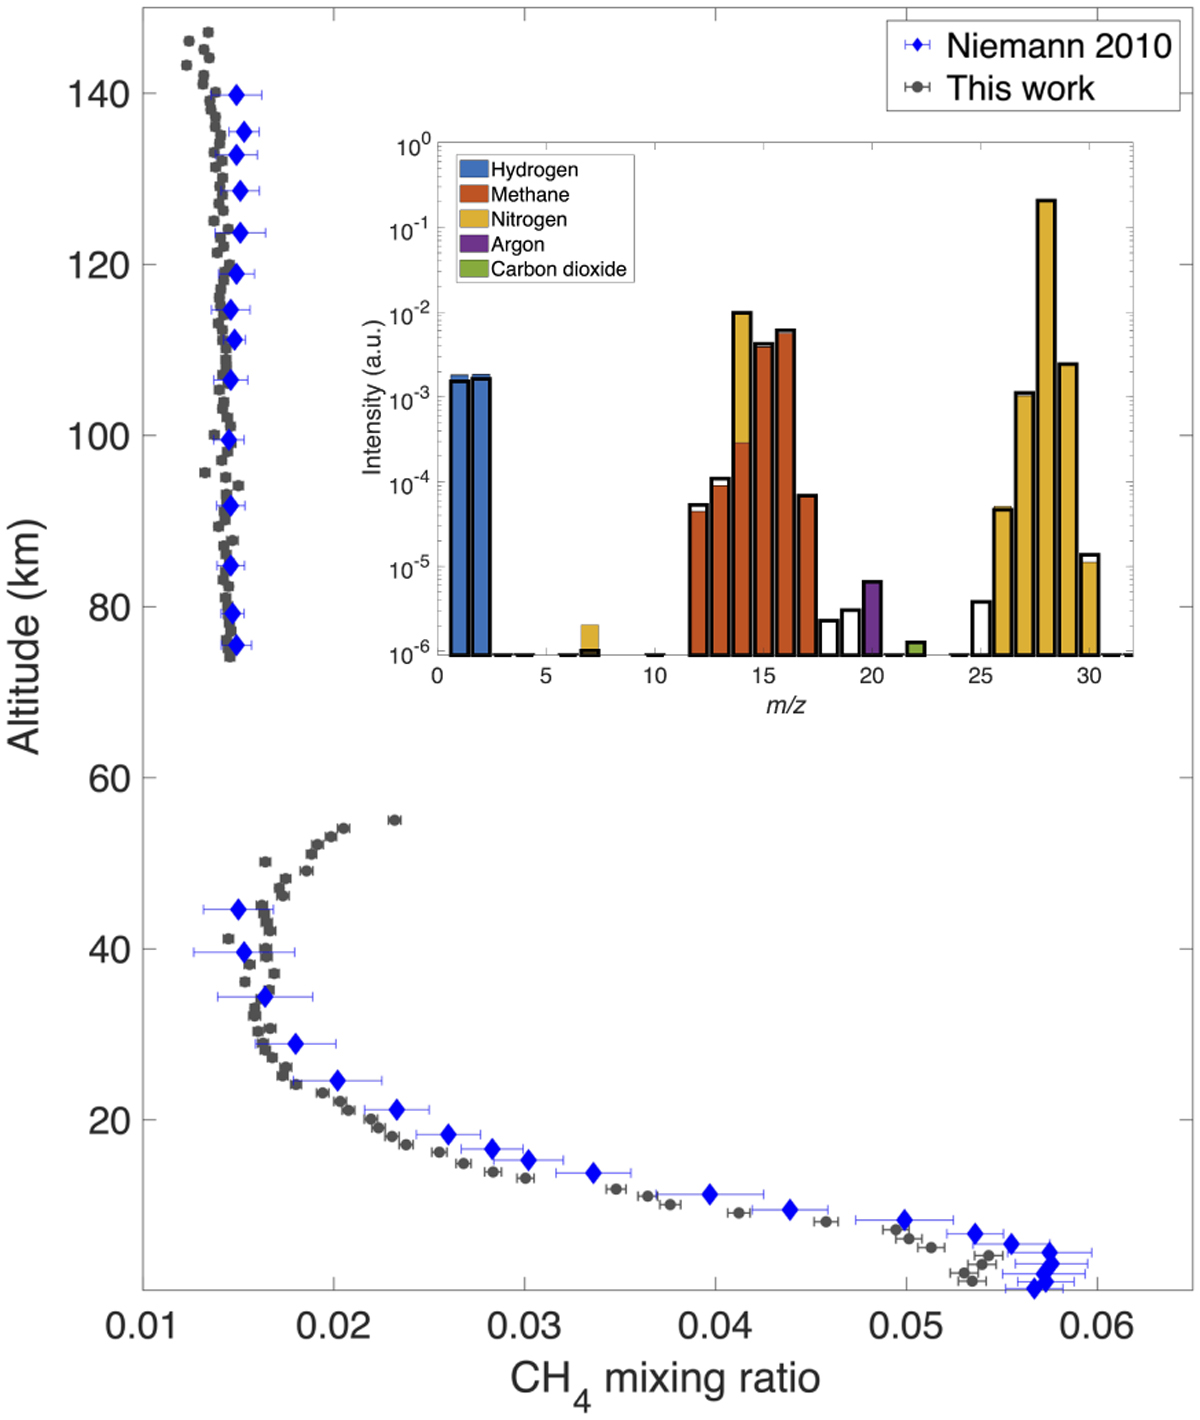
Fig. 4
Download original image
Retrieved methane mixing ratio through the lower atmosphere. Black dots: retrieved maximum probabilities for the CH4 mixing ratio as a function of altitude; associated error bars correspond to 1σ uncertainties assuming a Gaussian profile for the methane mixing ratio probability density function. Blue diamonds are the methane mixing ratio reported in Niemann et al. (2010). Data were stacked to a kilo-metric resolution before deconvolution. Insert shows the deconvolution for a typical mass spectrum recorded by Huygens at high altitude (here 130 km). Black bars are the measured signal and blue, orange, and green bars show the contribution of hydrogen, methane, and molecular nitrogen, respectively. Peaks at m/z 2, 12, and 13 are slightly underfitted to the contribution of higher order hydrocarbons to the signal, which is not shown here.
Current usage metrics show cumulative count of Article Views (full-text article views including HTML views, PDF and ePub downloads, according to the available data) and Abstracts Views on Vision4Press platform.
Data correspond to usage on the plateform after 2015. The current usage metrics is available 48-96 hours after online publication and is updated daily on week days.
Initial download of the metrics may take a while.