Fig. 1
Download original image
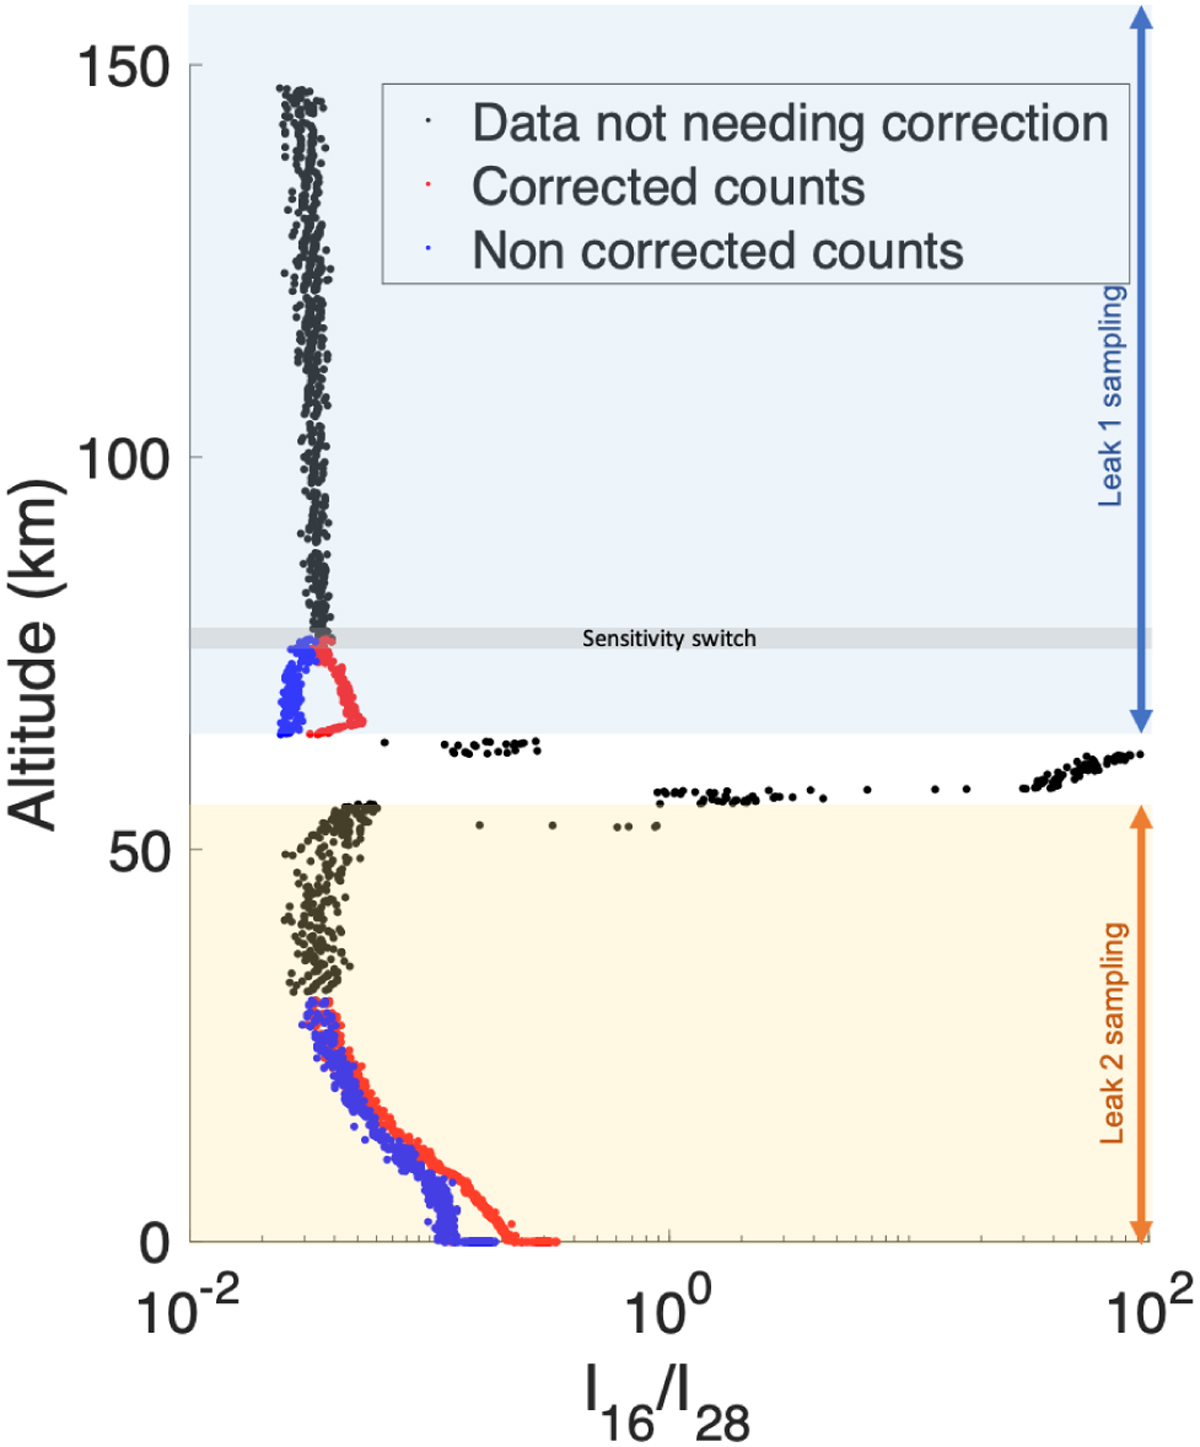
m/z 16 to m/z 28 count ratios in GCMS data versus altitude recorded during Huygens descent. Black dots correspond to raw counts archived in level 2 data requiring no correction. Blue dots correspond to raw counts for which a correction is required and red dots correspond to corrected counts using m/z 29 as a proxy when m/z 28 saturates. We note that the very sharp increase in counts at altitude 0 corresponds to outgassing after Huygens’s touchdown and GCMS continued recording atmospheric mass spectra for a couple of hours after the touchdown (not shown here). A comparison between the two correction methods using either m/z 14 or 29 as a proxy is given in Figure A.1.
Current usage metrics show cumulative count of Article Views (full-text article views including HTML views, PDF and ePub downloads, according to the available data) and Abstracts Views on Vision4Press platform.
Data correspond to usage on the plateform after 2015. The current usage metrics is available 48-96 hours after online publication and is updated daily on week days.
Initial download of the metrics may take a while.