Open Access
Fig. 7
Download original image
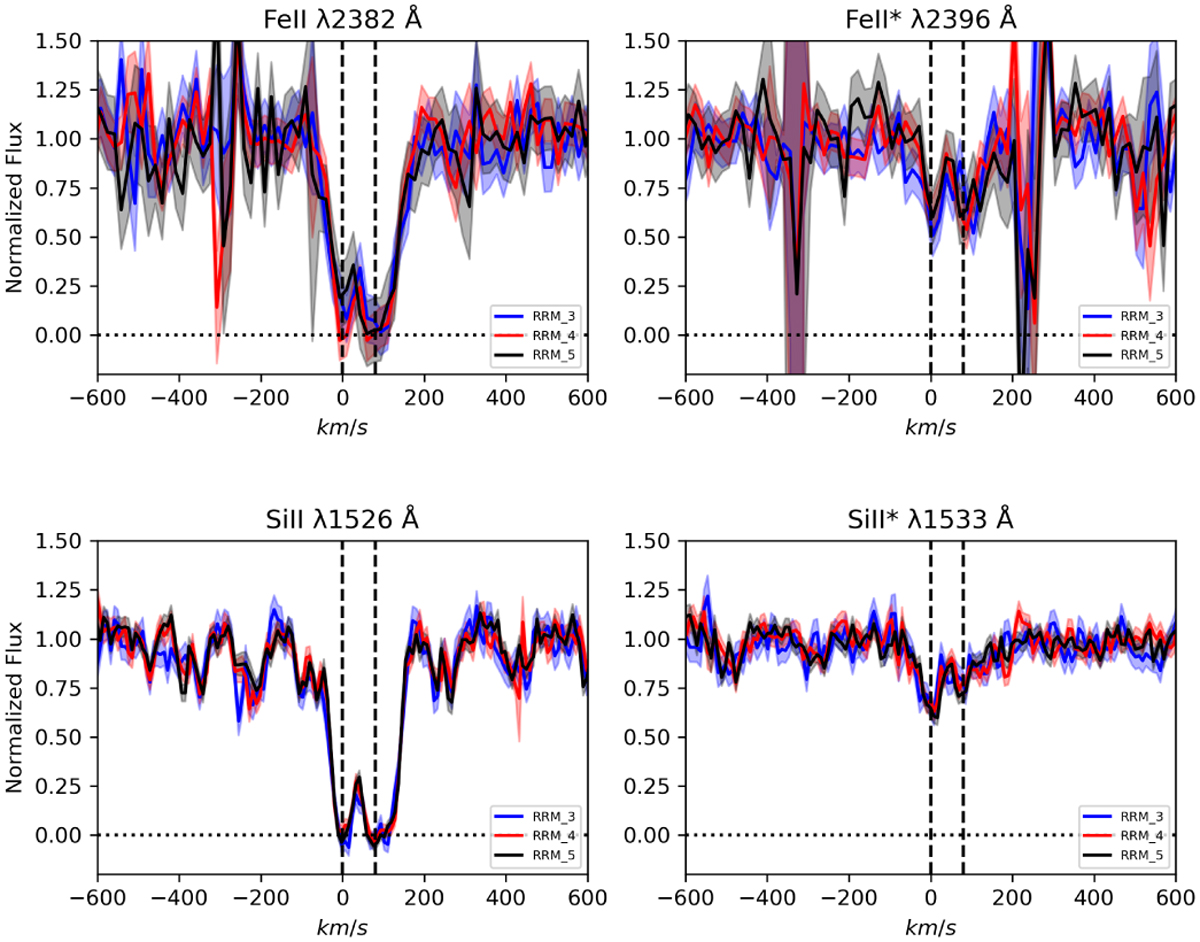
Resonance and fine-structure lines of Fe II (top) and Si II (bottom). The blue spectrum refers to RRM3, the red spectrum refers to RRM4, and the black line refers to RRM5. The shaded area around the solid lines represents the error spectra for each RRM.
Current usage metrics show cumulative count of Article Views (full-text article views including HTML views, PDF and ePub downloads, according to the available data) and Abstracts Views on Vision4Press platform.
Data correspond to usage on the plateform after 2015. The current usage metrics is available 48-96 hours after online publication and is updated daily on week days.
Initial download of the metrics may take a while.