Fig. 6
Download original image
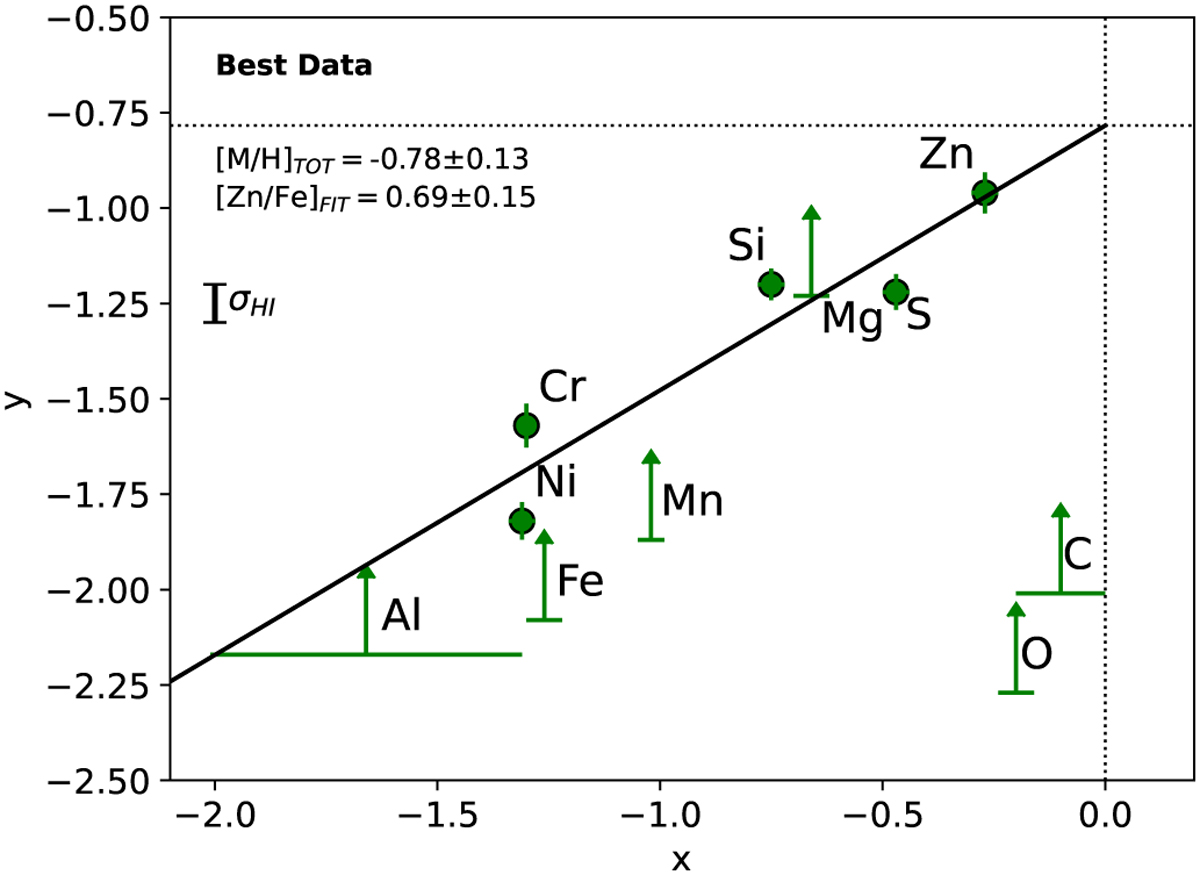
Best data observed abundance pattern. The x-axis shows the refractory index B2X from De Cia et al. (2021), while the y-axis is closely related to the observed abundances. The solid line shows the linear fit of the relation y = [Zn/Fe]FIT × x + [M/H]TOT to the observed abundances, not including the constraints from the limits.
Current usage metrics show cumulative count of Article Views (full-text article views including HTML views, PDF and ePub downloads, according to the available data) and Abstracts Views on Vision4Press platform.
Data correspond to usage on the plateform after 2015. The current usage metrics is available 48-96 hours after online publication and is updated daily on week days.
Initial download of the metrics may take a while.