Fig. 6.
Download original image
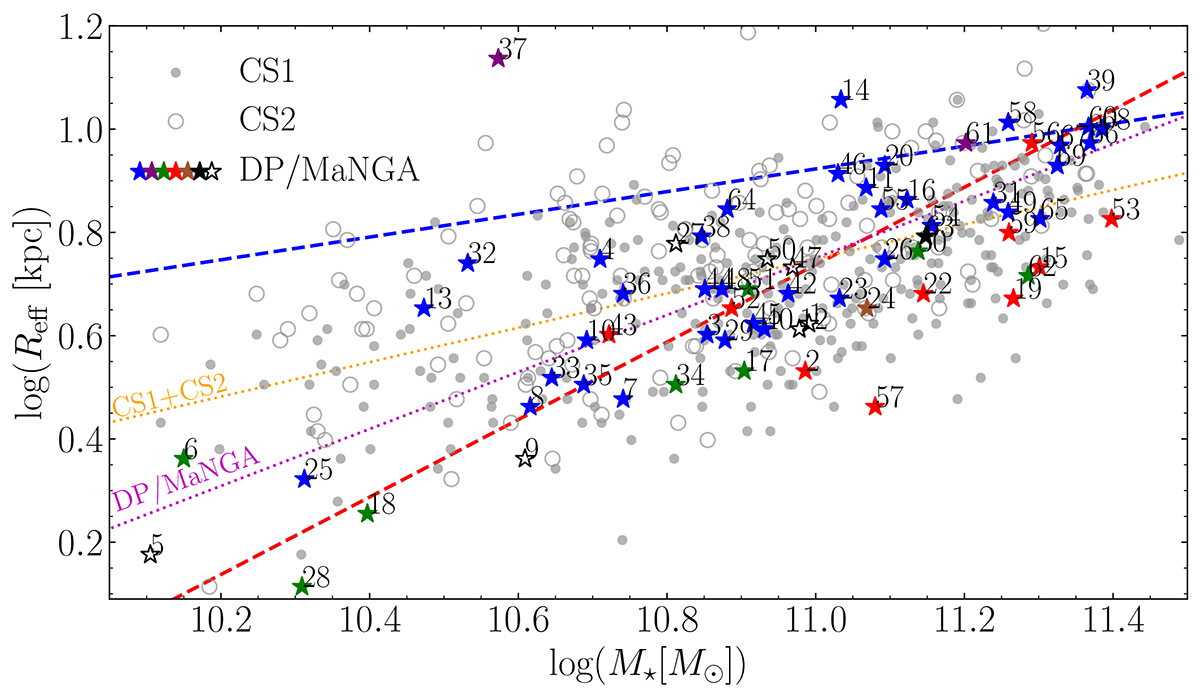
Size–stellar mass distribution for the DP/MaNGA galaxies. The dashed lines correspond to the low-z relations proposed by van der Wel et al. (2014) (![]() for ETGs in red and
for ETGs in red and ![]() for LTGs in blue). The colour-coding refers to the morphology: ⋆ETGs, that are ⋆ ellipticals, ⋆ S0; ⋆ mergers; ⋆ LTGs. The magenta dotted line refers to the relation found for the DP/MaNGA galaxies and the orange dotted line shows the best fit for the CS1 and CS2 combined.
for LTGs in blue). The colour-coding refers to the morphology: ⋆ETGs, that are ⋆ ellipticals, ⋆ S0; ⋆ mergers; ⋆ LTGs. The magenta dotted line refers to the relation found for the DP/MaNGA galaxies and the orange dotted line shows the best fit for the CS1 and CS2 combined.
Current usage metrics show cumulative count of Article Views (full-text article views including HTML views, PDF and ePub downloads, according to the available data) and Abstracts Views on Vision4Press platform.
Data correspond to usage on the plateform after 2015. The current usage metrics is available 48-96 hours after online publication and is updated daily on week days.
Initial download of the metrics may take a while.