Fig. 2.
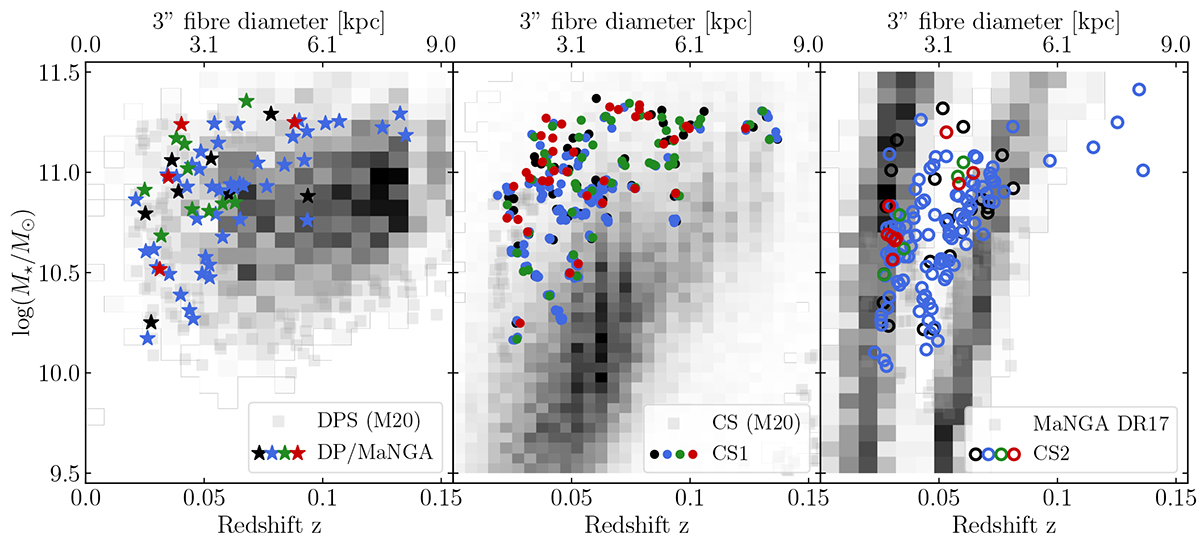
Download original image
Distribution in the M⋆ − z plane of the DP/MaNGA (colour-coded stars on left panel), CS1 (coloured dots on middle panel) and CS2 (coloured circles in right panel) galaxies. These three samples are respectively superimposed on the DPS distribution, the CS from Maschmann et al. (2020), and the whole MaNGA sample from DR17 (Bundy et al. 2015; Abdurro’uf et al. 2022). The bimodality of the MaNGA sample distribution is due to the survey design criteria. The colour coding refers to the NUV − r colour: ⋆blue cloud galaxies, ⋆green valley galaxies; ⋆ red sequence galaxies; ⋆ no NUV − r measurement available.
Current usage metrics show cumulative count of Article Views (full-text article views including HTML views, PDF and ePub downloads, according to the available data) and Abstracts Views on Vision4Press platform.
Data correspond to usage on the plateform after 2015. The current usage metrics is available 48-96 hours after online publication and is updated daily on week days.
Initial download of the metrics may take a while.