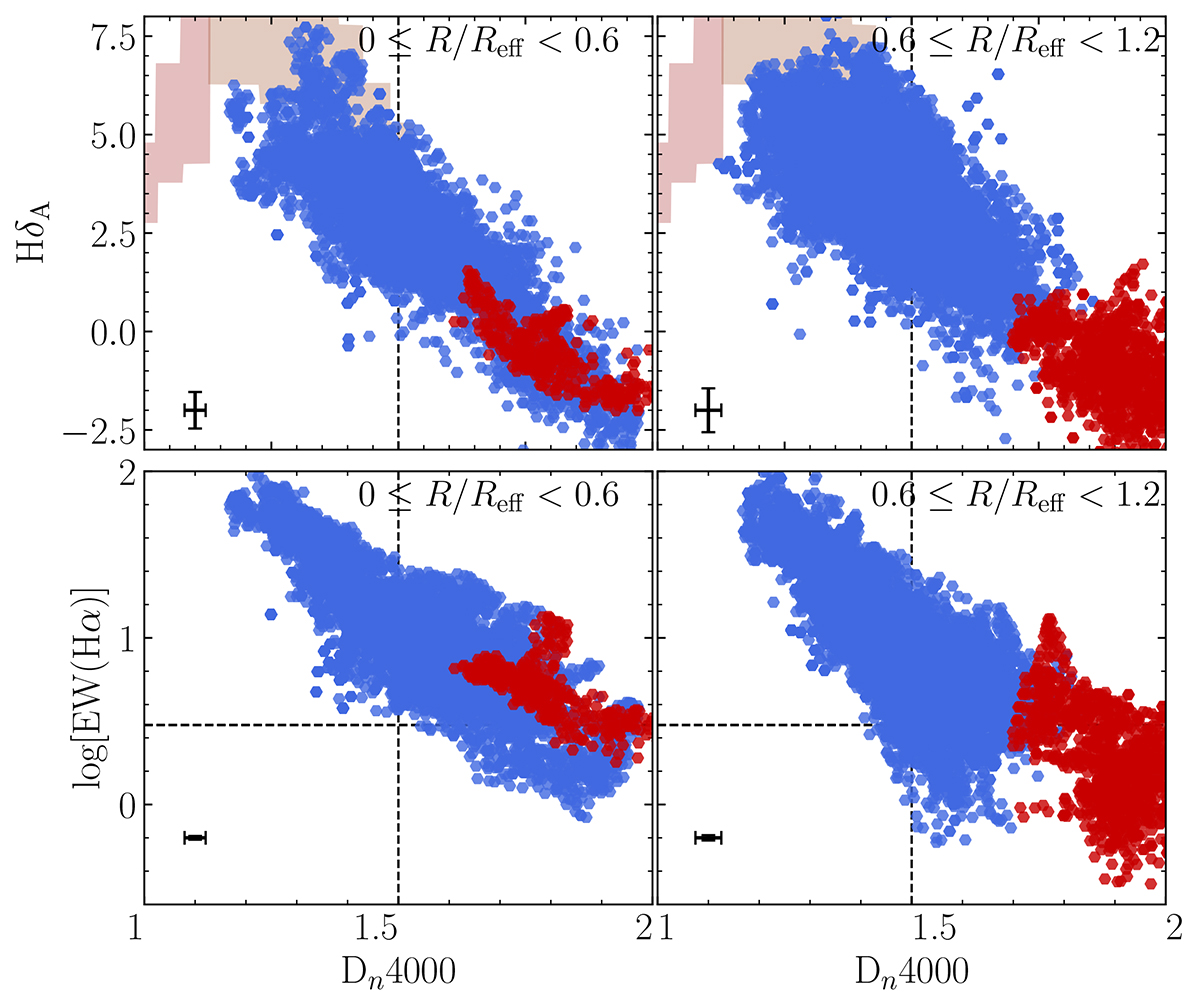
Fig. 18.
Download original image
Stellar age indicators for individual spaxels of the blue cloud and red sequence galaxies, represented in blue and red respectively, in different radial bins. The crosses at the bottom-left corner display the mean uncertainties on the spaxel measurements in the corresponding radial bin. The uncertainties on log[EW(Hα)] are 0.01 and 0.02 respectively. The brownish areas indicate regions where the galaxy can be identified as having undergone a burst in the past 2 Gyr. The darker shade denotes areas where galaxies are most likely currently experiencing or have recently experienced a burst that started within the last 0.1 Gyr (details in Kauffmann et al. 2003b).
Current usage metrics show cumulative count of Article Views (full-text article views including HTML views, PDF and ePub downloads, according to the available data) and Abstracts Views on Vision4Press platform.
Data correspond to usage on the plateform after 2015. The current usage metrics is available 48-96 hours after online publication and is updated daily on week days.
Initial download of the metrics may take a while.