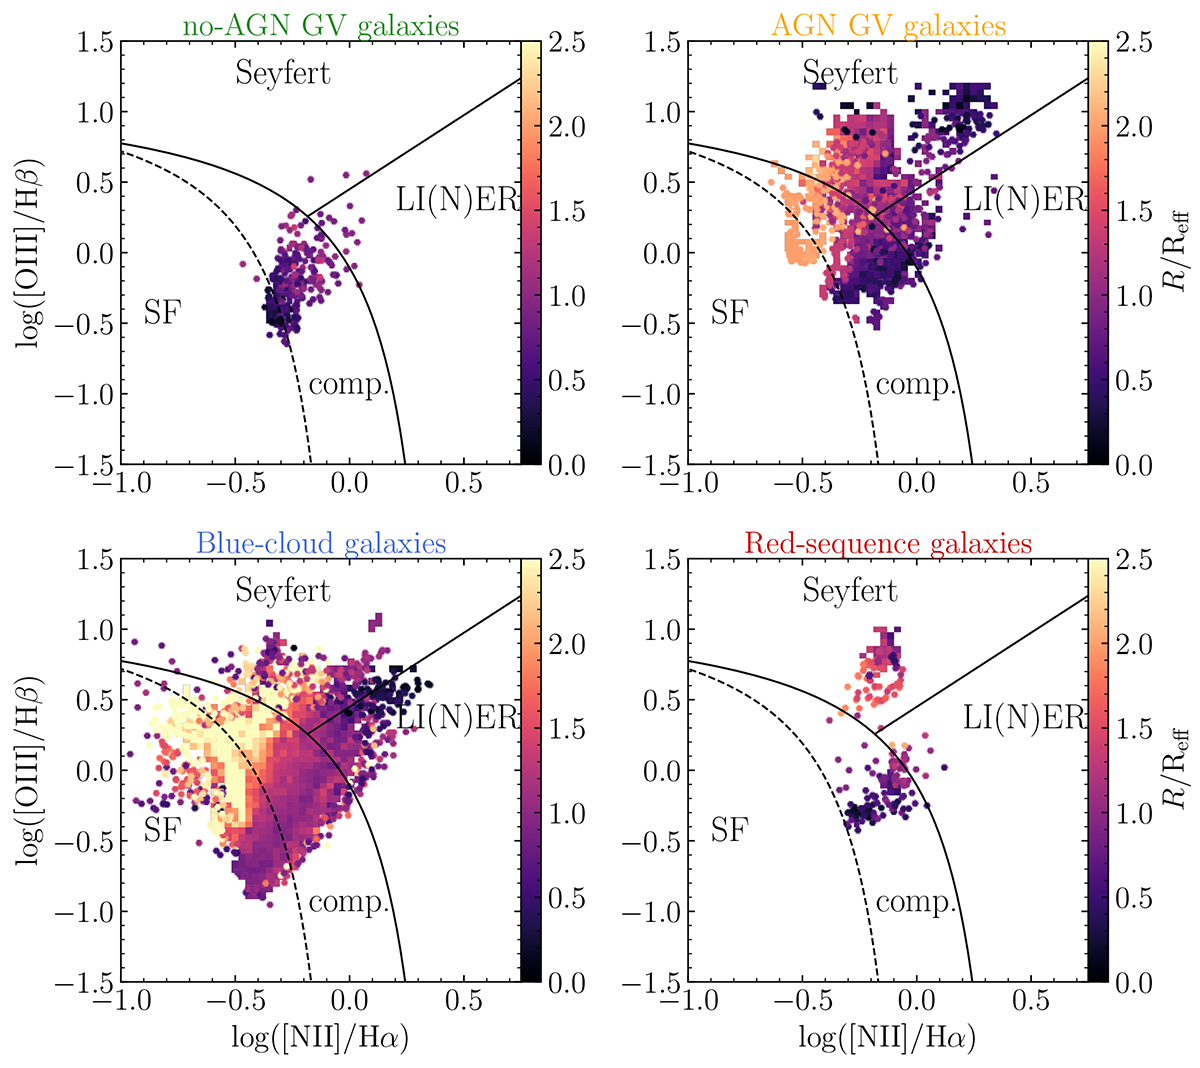
Fig. 17.
Download original image
Spaxel-by-spaxel BPT diagrams. The empirical demarcation line between pure star formation and composite excitation is dashed (Kauffmann et al. 2003a). The solid curved line corresponds to the distinction between the excitation due to starbursts and that due to other mechanisms (Kewley et al. 2001). The empirical Seyfert-LI(N)ER line is the one from Schawinski et al. (2007). The colour coding indicates the distance to the centre, in units of Reff.
Current usage metrics show cumulative count of Article Views (full-text article views including HTML views, PDF and ePub downloads, according to the available data) and Abstracts Views on Vision4Press platform.
Data correspond to usage on the plateform after 2015. The current usage metrics is available 48-96 hours after online publication and is updated daily on week days.
Initial download of the metrics may take a while.