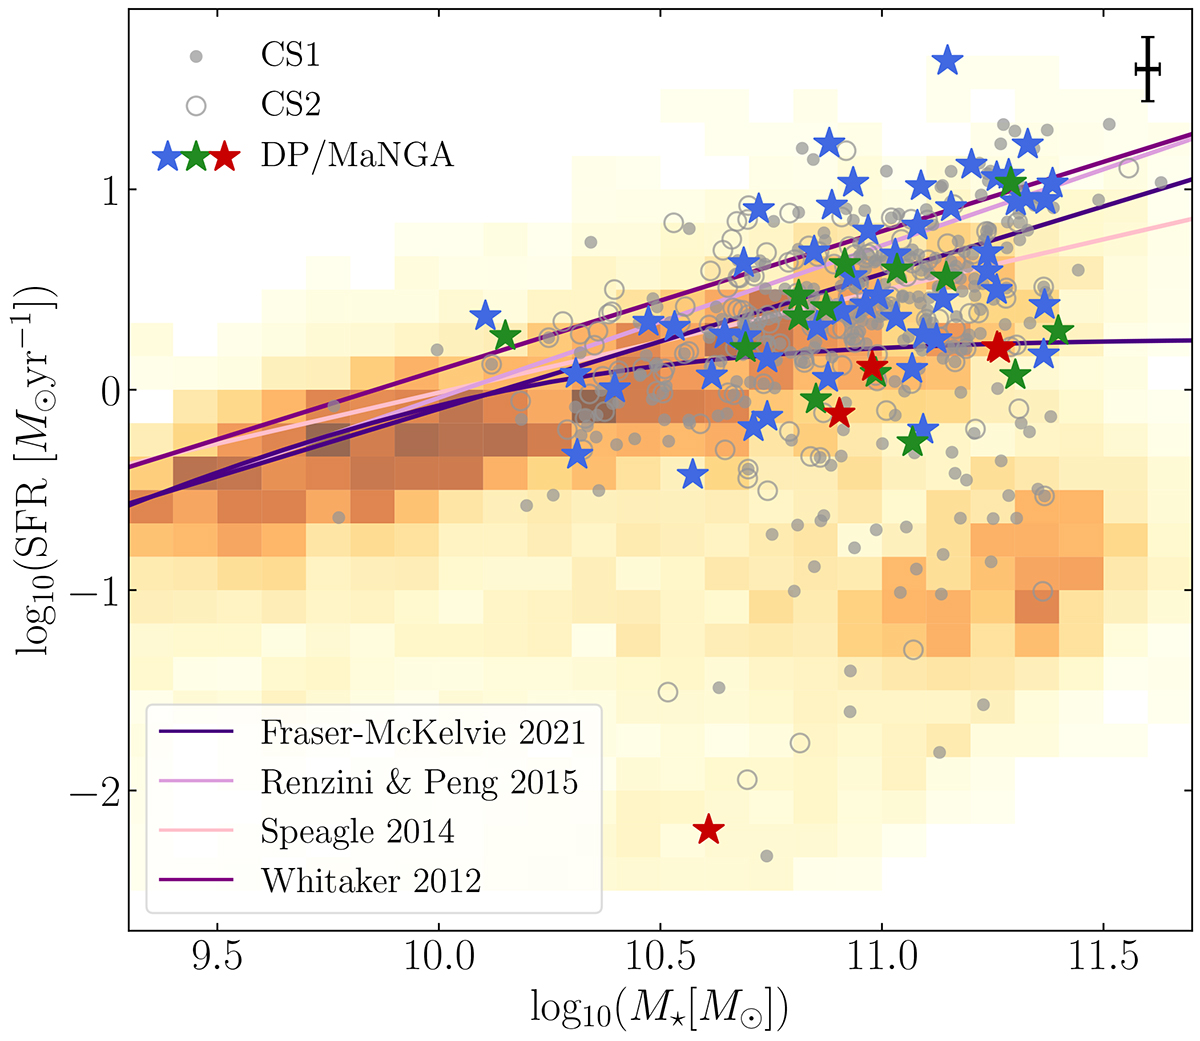
Fig. 11.
Download original image
SFR vs. stellar mass diagram. The DP/MaNGA are represented by coloured stars. The SFR and stellar masses are based on Salim et al. (2016), except for G17, G25, G56, and G64 (based on Brinchmann et al. 2004). The median uncertainty for the DP/MaNGA sample is shown in the top-right. The galaxies from the control samples are shown in grey. The underlying orange 2D histogram represents the galaxies from the MaNGA DR17 with corresponding measurements from Salim et al. (2016).
Current usage metrics show cumulative count of Article Views (full-text article views including HTML views, PDF and ePub downloads, according to the available data) and Abstracts Views on Vision4Press platform.
Data correspond to usage on the plateform after 2015. The current usage metrics is available 48-96 hours after online publication and is updated daily on week days.
Initial download of the metrics may take a while.