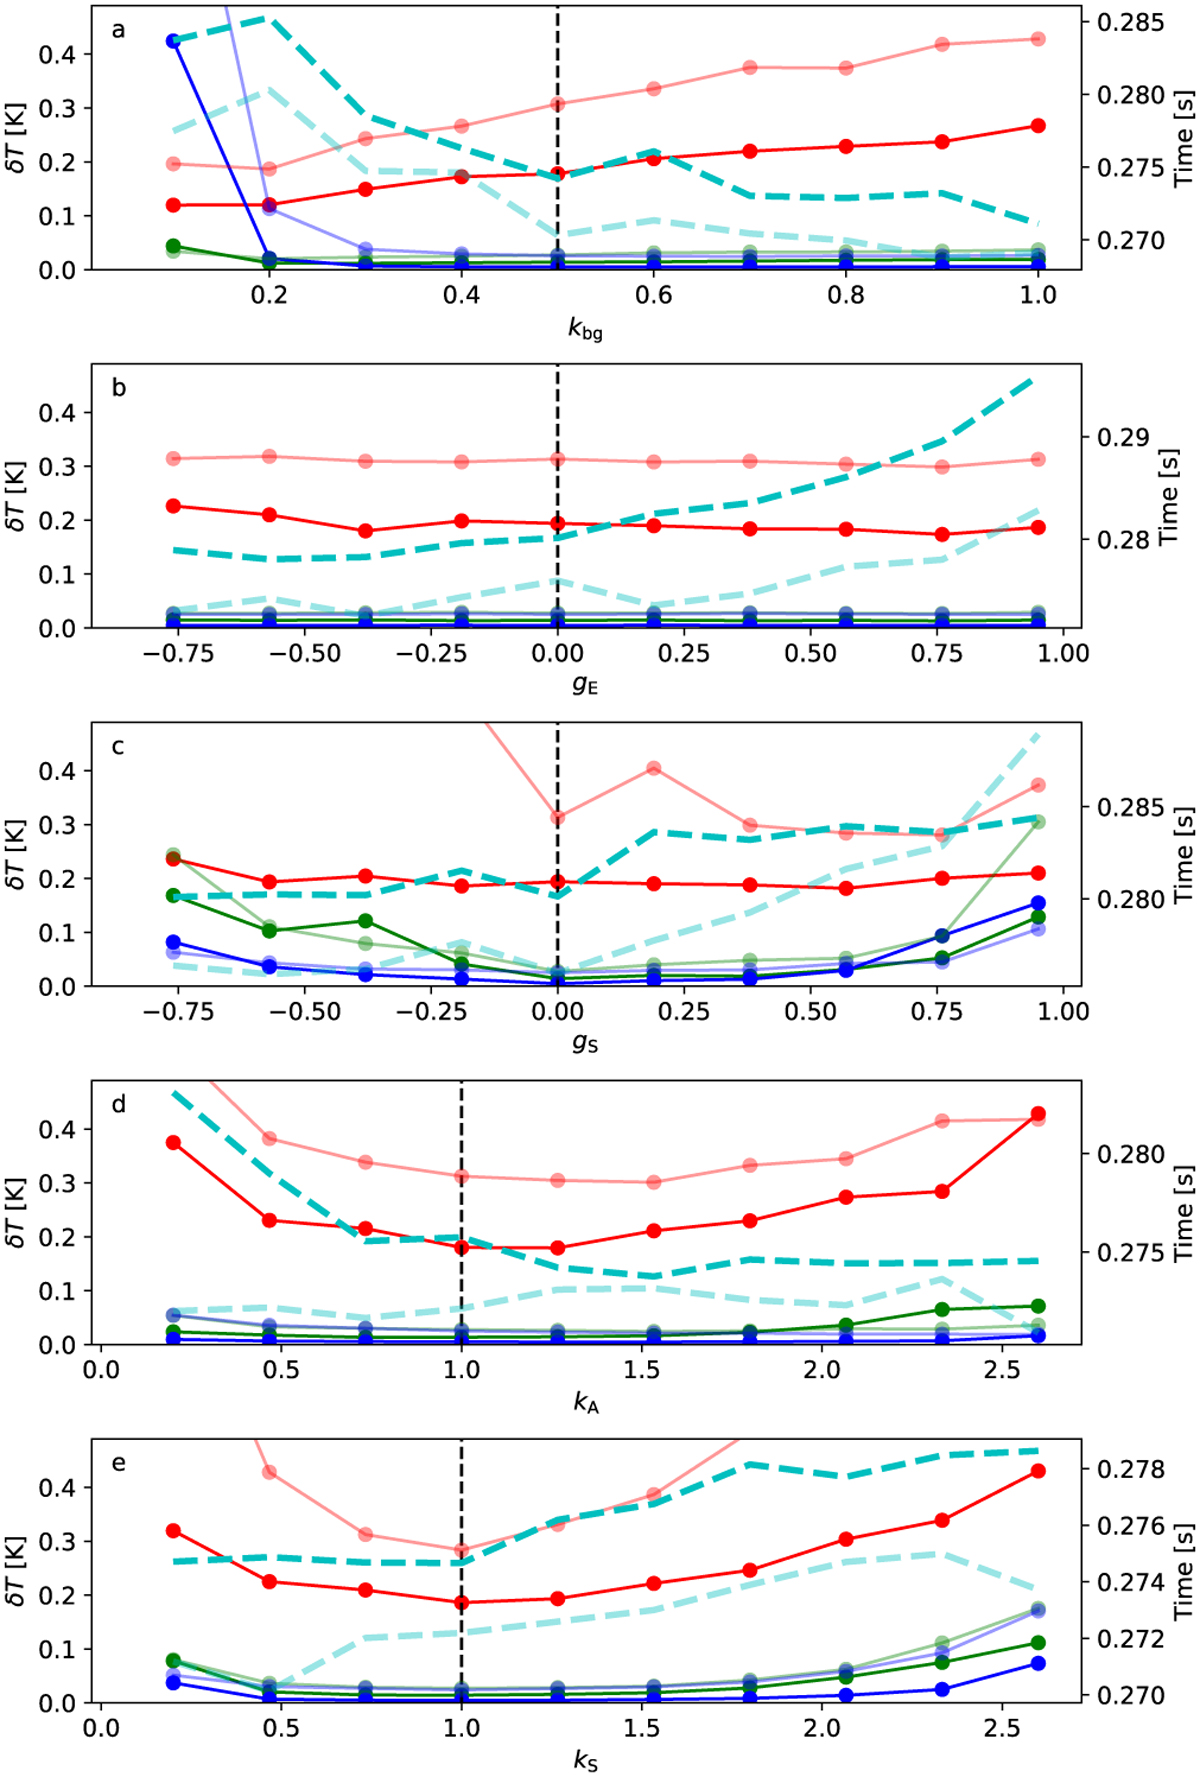
Fig. 5
Download original image
Relative accuracy of temperature estimates in the case of weighted sampling. Each frame corresponds to one of the weighting parameters listed in Table 1. The errors are shown for the surface (blue curves), the half-radius point (green curves), and the centre of the model. The vertical dashed lines mark the default solution without weighting. The dark lines correspond to the 0.2 M⊙ and the light (transparent) curves to the 10 M⊙ models. The cyan lines and the right hand axis show the corresponding run times for the simulation step only.
Current usage metrics show cumulative count of Article Views (full-text article views including HTML views, PDF and ePub downloads, according to the available data) and Abstracts Views on Vision4Press platform.
Data correspond to usage on the plateform after 2015. The current usage metrics is available 48-96 hours after online publication and is updated daily on week days.
Initial download of the metrics may take a while.