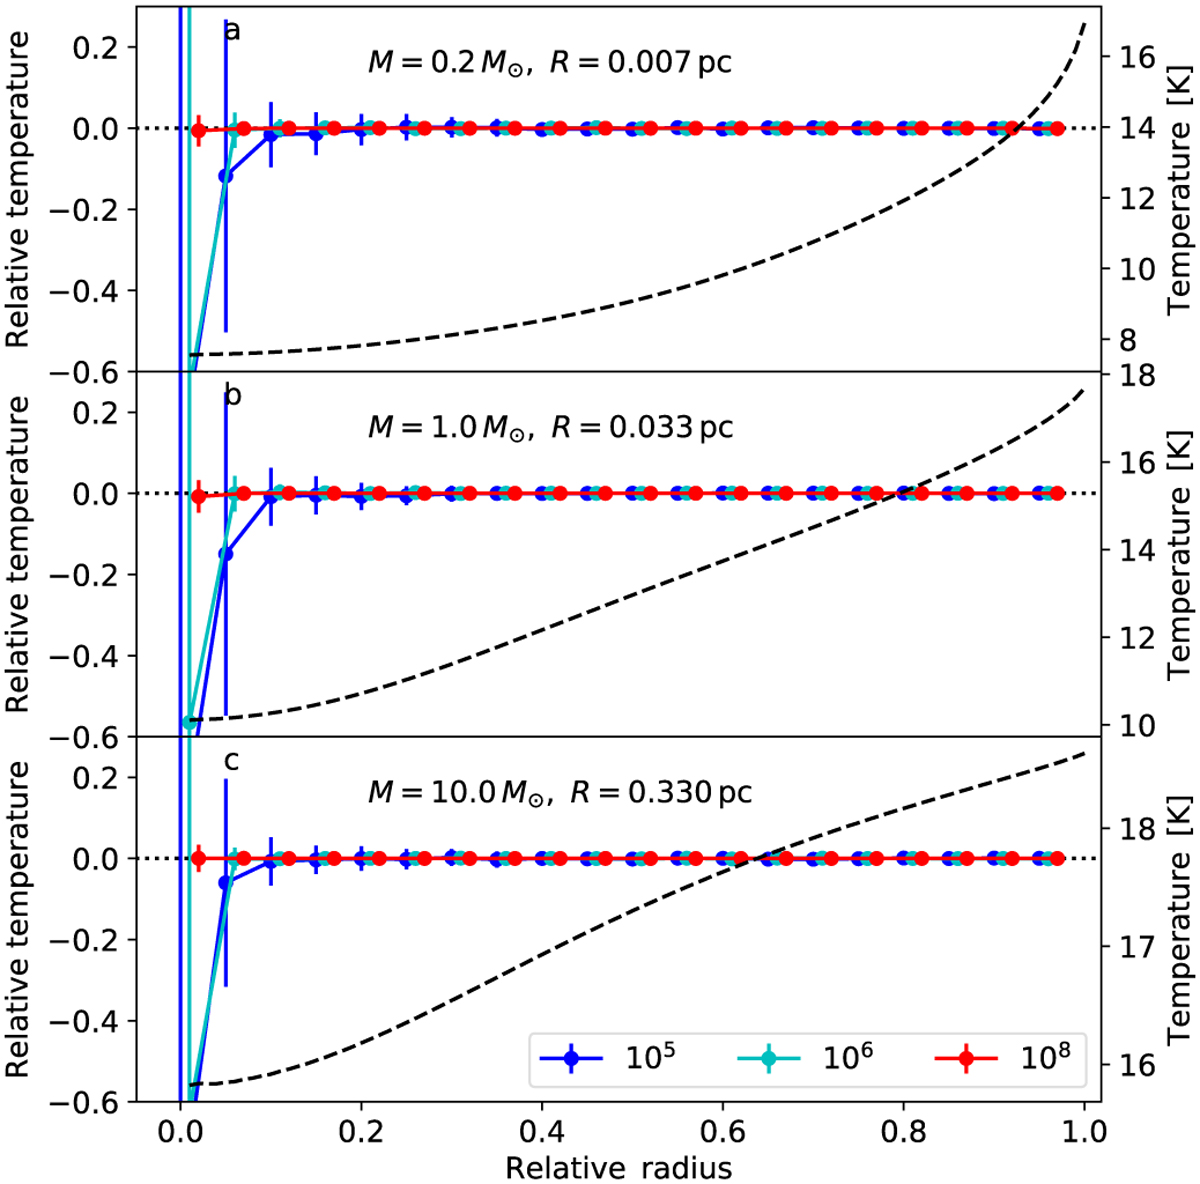
Fig. 2
Download original image
Accuracy of temperature estimates for externally heated models as a function radial position. The frames correspond to 0.2, 1.0, and 10 M⊙ mass models, with the outer radii given in the figure. The dashed black line and the right axis indicate the dust temperatures calculated with 109 photon packages. Compared to this reference solution, the blue, cyan, and red symbols show the results (temperature ratios) for smaller samples of 105, 106, and 108 photon packages. These are plotted for every fifth cell, starting with the centre cell, and adding small shift along the x-axis for better readability. The error bars show the 1σ temperature dispersion based on 100 independent runs.
Current usage metrics show cumulative count of Article Views (full-text article views including HTML views, PDF and ePub downloads, according to the available data) and Abstracts Views on Vision4Press platform.
Data correspond to usage on the plateform after 2015. The current usage metrics is available 48-96 hours after online publication and is updated daily on week days.
Initial download of the metrics may take a while.