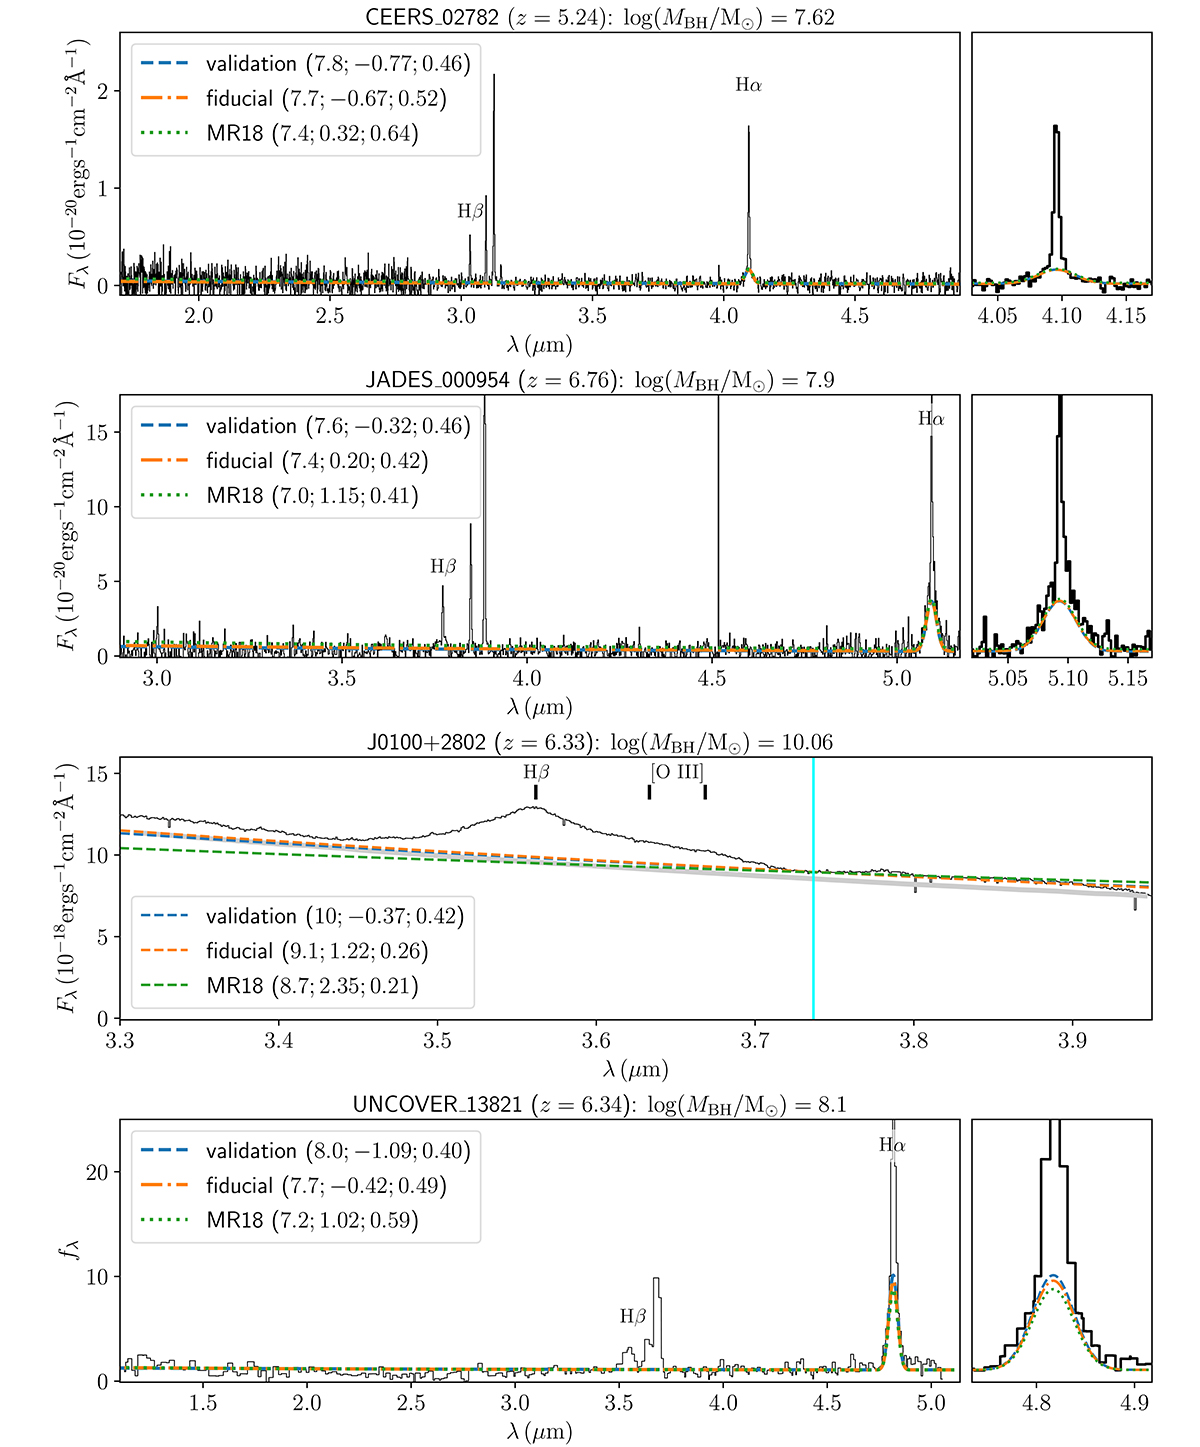
Fig. 5.
Download original image
Reconstructed spectra for four selected sources in our sample: CEERS_02782, JADES_000954, J0100+2802, and UNCOVER_13821. The observed spectra (obtained from the public data release of the different programs, except for the UNCOVER source, which was extracted from the published paper) are shown as solid black lines (the right panel shows a zoom on the Hα line), the dashed blue, dash-dotted orange, and dotted green lines refer to our validation, to the fiducial, and to the MR18 models, respectively. The vertical cyan line in J0100+2802 corresponds to λ = 5100 Å redshifted to the observer frame, which we used to constrain the models. The grey line corresponds to the power-law continuum component from the fit by Yue et al. (2024). All but the UNCOVER source report absolute fluxes, whereas in the UNCOVER case, the flux is normalised to the luminosity at 2500 Å, as was done in Greene et al. (2024). The numbers reported in the legend correspond to the parameters employed for each model log(MMBH/M⊙), log(L/LEdd), and aBH, whereas the mass estimates above each panel correspond to those in the corresponding discovery papers.
Current usage metrics show cumulative count of Article Views (full-text article views including HTML views, PDF and ePub downloads, according to the available data) and Abstracts Views on Vision4Press platform.
Data correspond to usage on the plateform after 2015. The current usage metrics is available 48-96 hours after online publication and is updated daily on week days.
Initial download of the metrics may take a while.