Fig. 4.
Download original image
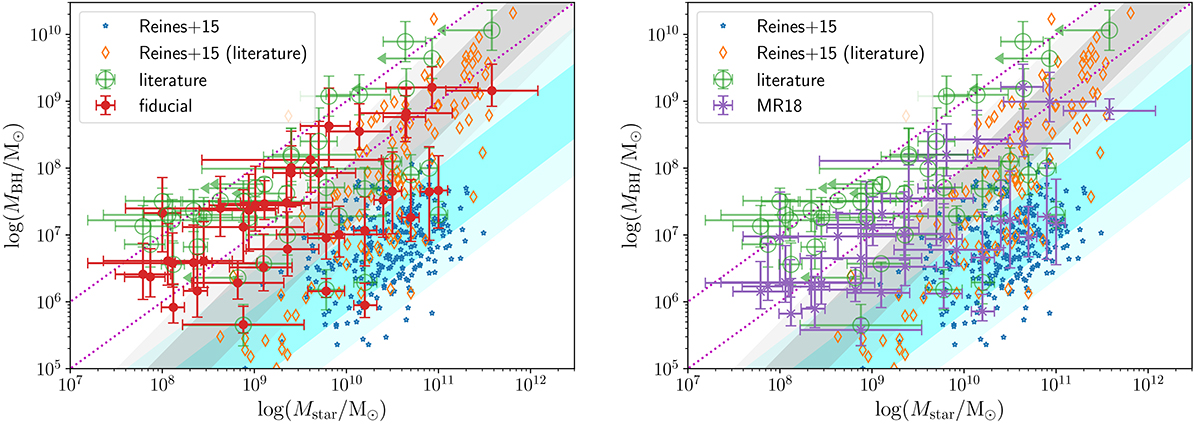
MBH mass–stellar mass relation for the sources in our sample. We show the local AGN from Reines & Volonteri (2015) as blue stars and orange diamonds, with the underlying shaded area correspond to the 1σ and 2σ uncertainties around the best fits to the local samples (grey and cyan for inactive and active galaxies, respectively). The original data from the literature are shown as green circles, whereas our new estimates are reported as red dots (left panel) and purple crosses (right panel) for the two virial factors considered. For completeness, we also show as the dotted magenta lines constant mass ratios of 0.01 and 0.1.
Current usage metrics show cumulative count of Article Views (full-text article views including HTML views, PDF and ePub downloads, according to the available data) and Abstracts Views on Vision4Press platform.
Data correspond to usage on the plateform after 2015. The current usage metrics is available 48-96 hours after online publication and is updated daily on week days.
Initial download of the metrics may take a while.