Fig. 3.
Download original image
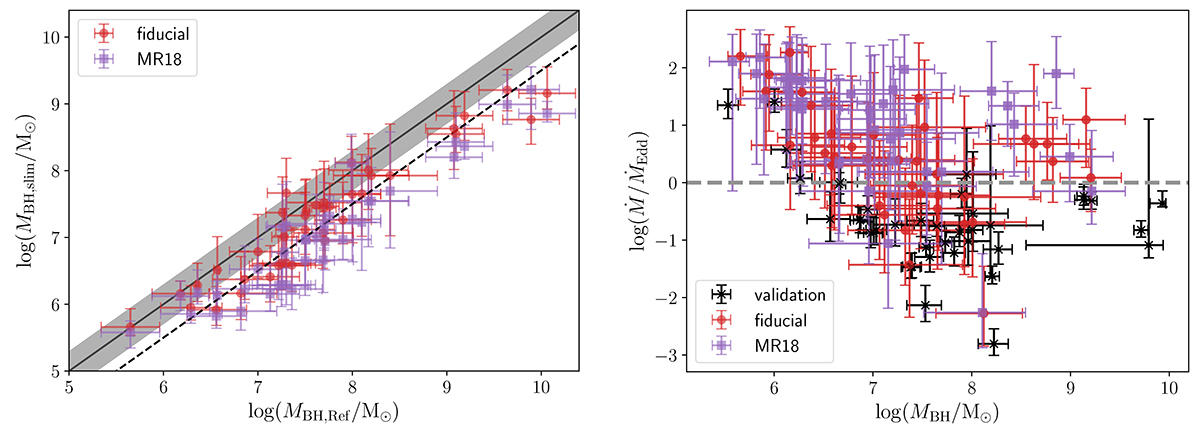
In the left panel, we show the MBH mass estimates (as in Fig. 1), but for our full model, with the estimates of the entire sample shown as red dots (fiducial) and purple squares (MR18). The dashed black line is plotted to guide the eye and corresponds to a 0.5 dex offset relative to the 1:1 relation. In the right panel we show instead the Eddington ratio distribution for our fiducial model (red dots), the MR18 case (purple squares), and the validation run (black crosses) as a function of the estimated MBH mass. The thick dashed grey line corresponds to the Eddington limit.
Current usage metrics show cumulative count of Article Views (full-text article views including HTML views, PDF and ePub downloads, according to the available data) and Abstracts Views on Vision4Press platform.
Data correspond to usage on the plateform after 2015. The current usage metrics is available 48-96 hours after online publication and is updated daily on week days.
Initial download of the metrics may take a while.