Fig. 1.
Download original image
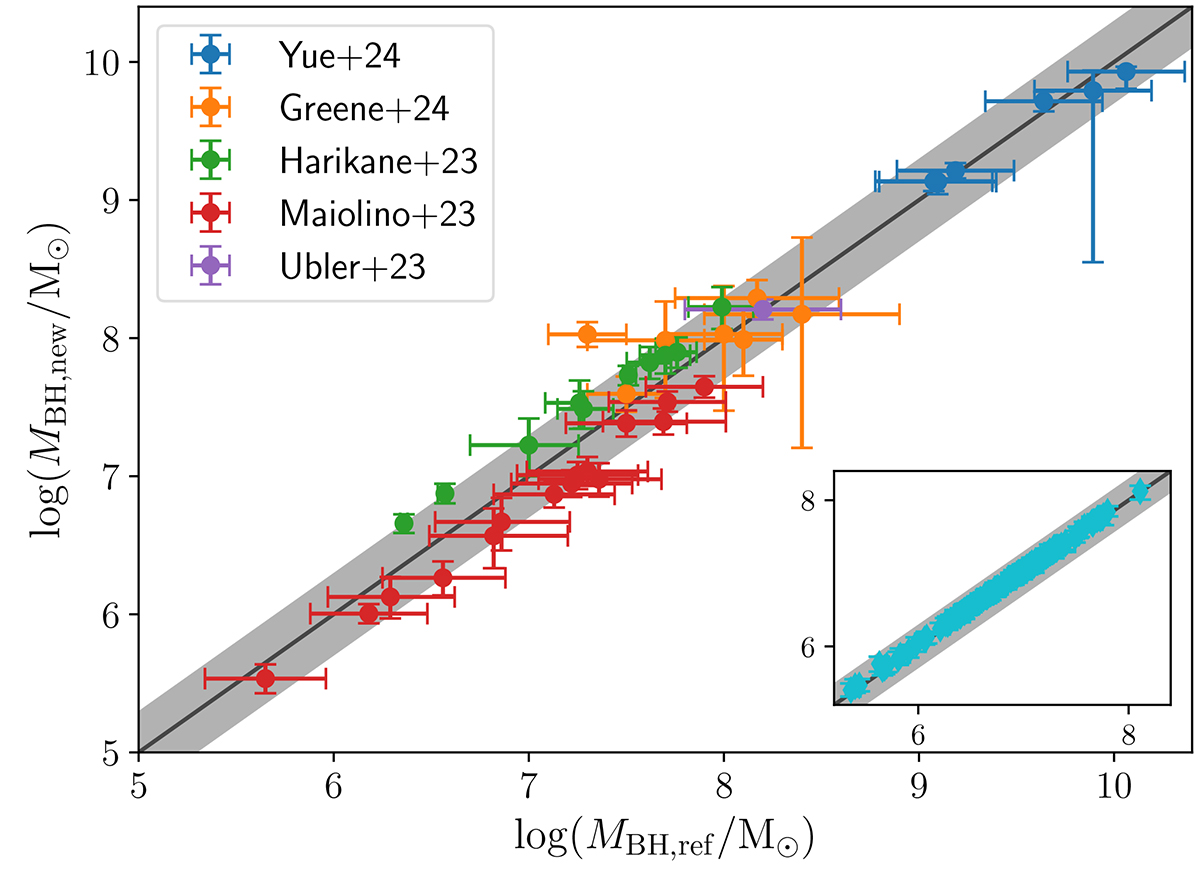
MBH estimates from the MCMC for the validation run against the MBH mass reported in the observational studies. The black line corresponds to the 1:1 relation, and the grey shaded area is 0.3 dex wide. The dots correspond to the MBHs in Yue et al. (2024, blue), Greene & Ho (2005, orange), Harikane et al. (2023, green), Maiolino et al. (2023, red), and Übler et al. (2023, purple). In the inset, we show the results obtained for the Reines & Volonteri (2015) data as cyan crosses.
Current usage metrics show cumulative count of Article Views (full-text article views including HTML views, PDF and ePub downloads, according to the available data) and Abstracts Views on Vision4Press platform.
Data correspond to usage on the plateform after 2015. The current usage metrics is available 48-96 hours after online publication and is updated daily on week days.
Initial download of the metrics may take a while.