Fig. 7
Download original image
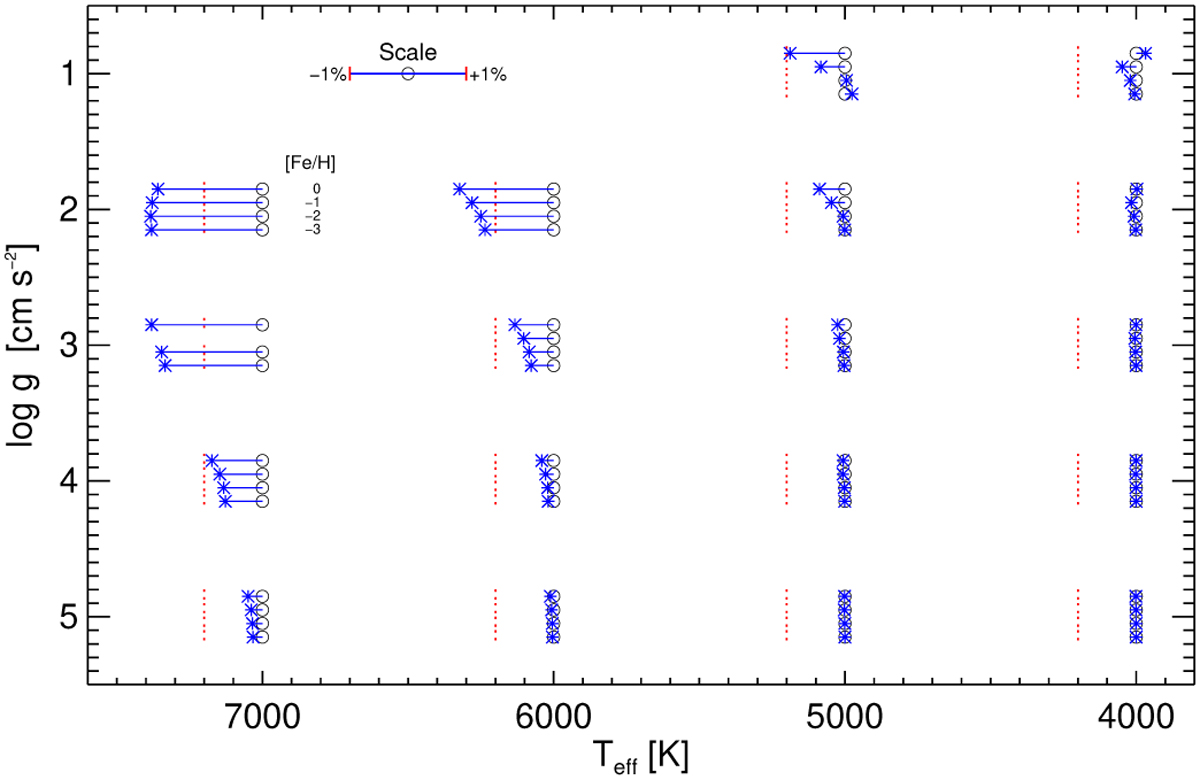
Summary of the effects of departures from LTE for H− on the visual continuum, roughly 400-800 nm, across the grid of models. For each Teff, log 𝑔 combination, the results are shown for four [Fe/H] each slightly offset in the vertical direction such that the highest metallicity is highest in the plot. For each case, a circle marks the position of no change, and then an asterisk displaced in the horizontal direction gives the maximum change in the continuum relative to LTE. The scale is shown in the upper left corner, and the position of a −1% change is marked in each case with a dashed red line. For example, for the case given in Fig. 5, Teff = 7000 K, log 𝑔 = 4.0, and [Fe/H] = 0, the uppermost line in this group shows a relative change of just below −1 %, as shown in the lower panel of Fig. 5.
Current usage metrics show cumulative count of Article Views (full-text article views including HTML views, PDF and ePub downloads, according to the available data) and Abstracts Views on Vision4Press platform.
Data correspond to usage on the plateform after 2015. The current usage metrics is available 48-96 hours after online publication and is updated daily on week days.
Initial download of the metrics may take a while.