Fig. 5
Download original image
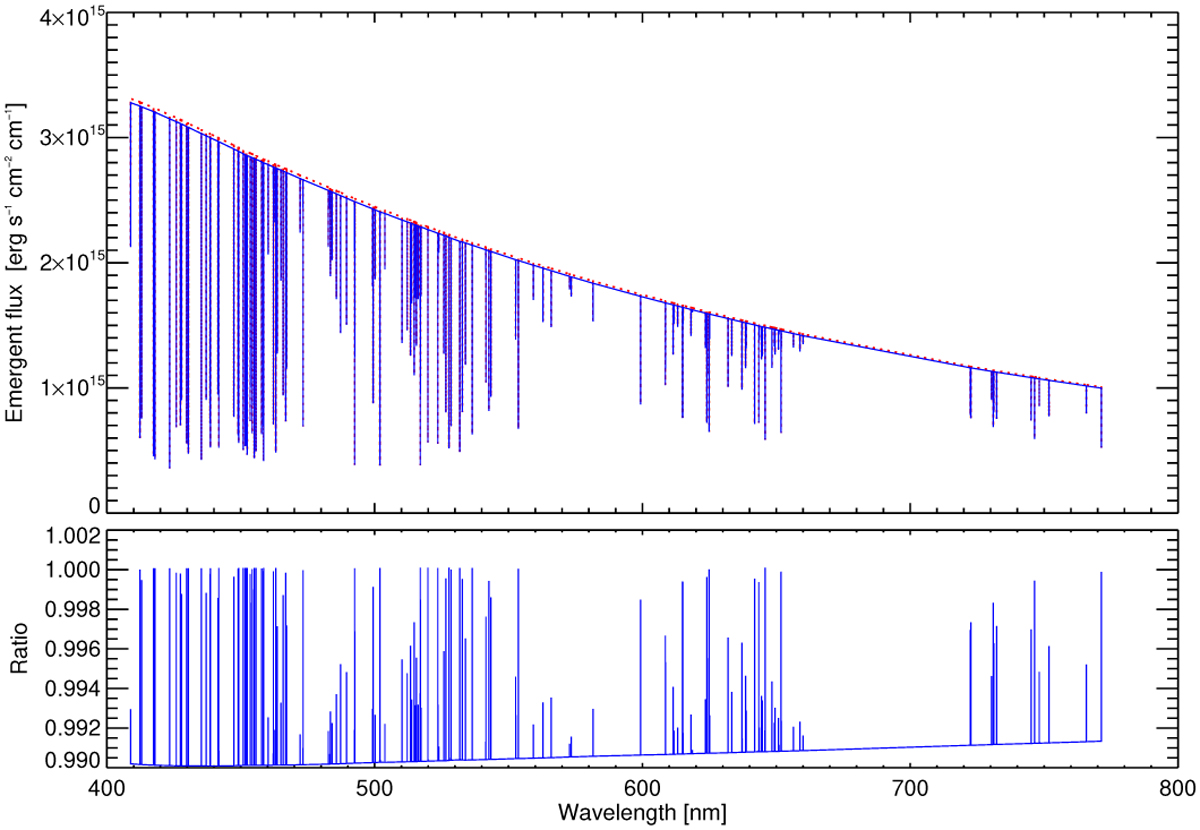
Effect on the spectrum (continuum and Fe II lines) in the visual, roughly 400–800 nm, for a model with Teff = 7000 K, log 𝑔 = 4.0, and [Fe/H] = 0. The upper plot shows the emergent flux at the stellar surface 𝓕λ. The blue line shows H− treated in non-LTE (𝓕λ), and the dotted red line shows it in LTE ![]() . The lower panel shows the ratio
. The lower panel shows the ratio ![]() .
.
Current usage metrics show cumulative count of Article Views (full-text article views including HTML views, PDF and ePub downloads, according to the available data) and Abstracts Views on Vision4Press platform.
Data correspond to usage on the plateform after 2015. The current usage metrics is available 48-96 hours after online publication and is updated daily on week days.
Initial download of the metrics may take a while.