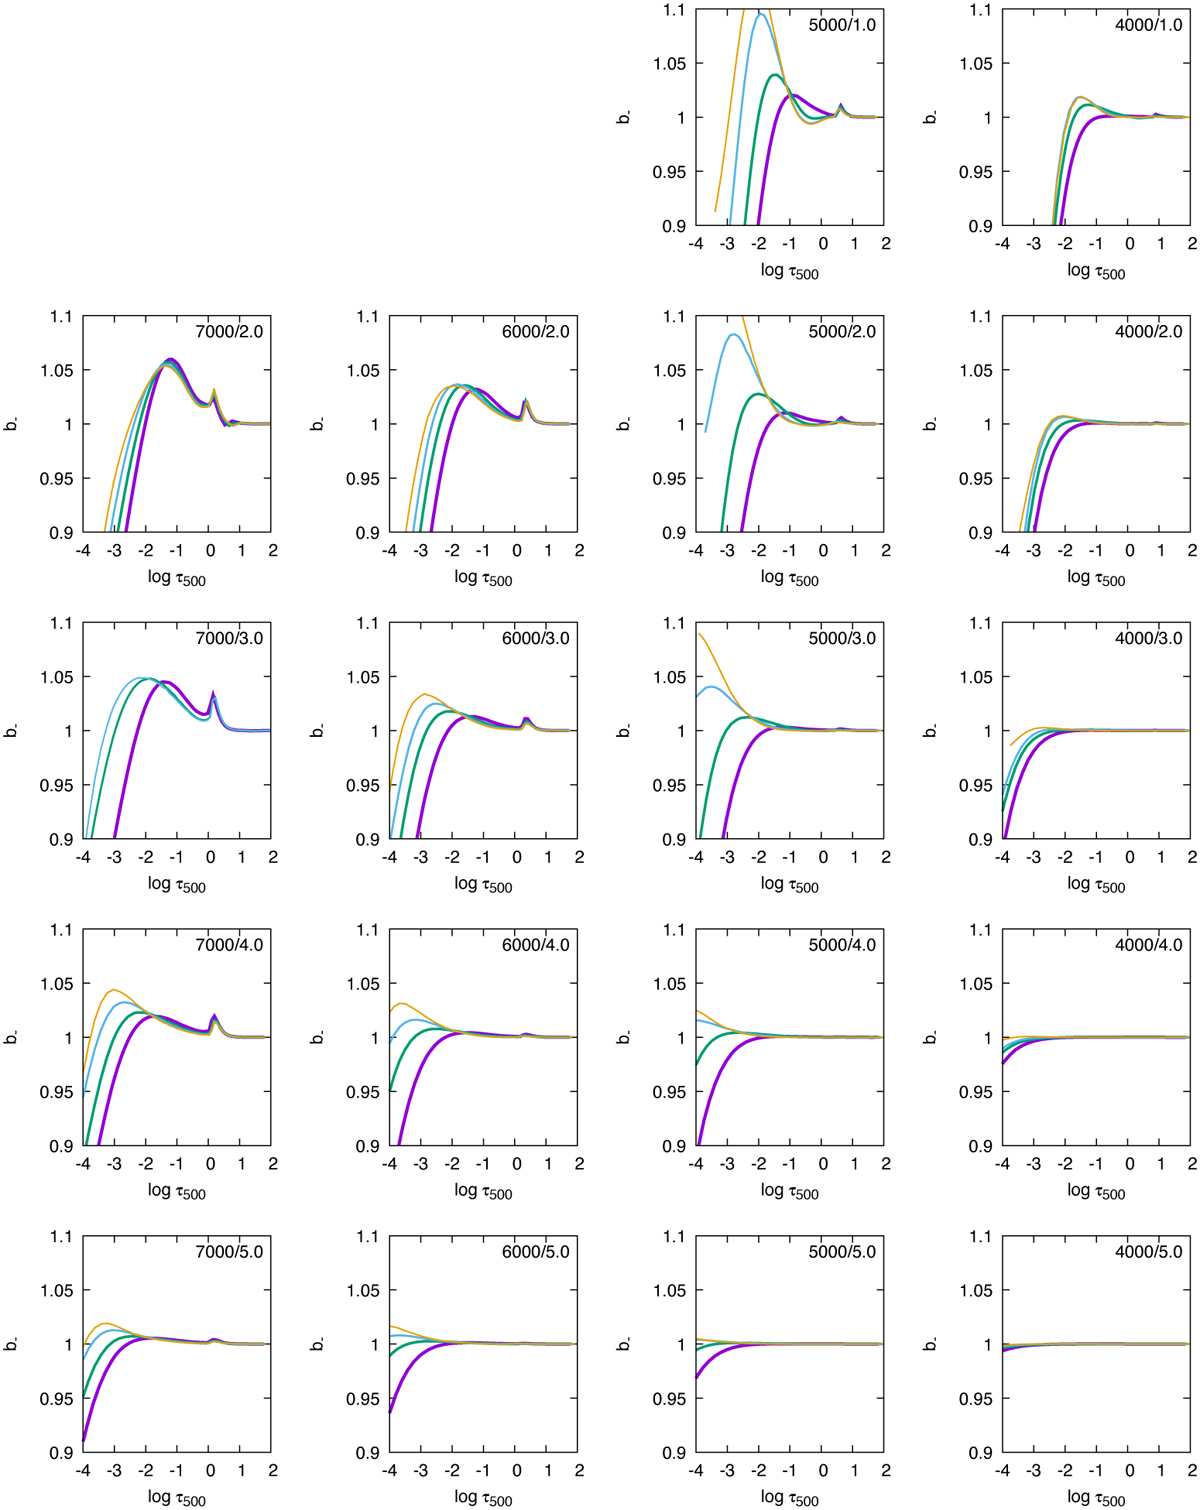
Fig. 3
Download original image
Results for departure coefficients b_ with the logarithm of the optical depth at 500 nm, log τ500, across a grid of MARCS model atmospheres. In the upper right corner of each panel Teff/ log 𝑔 is given, and each panel shows plots for different metallicity [Fe/H] = 0, −1, −2, and −3. The thickest (purple) line shows 0, and the thinnest (orange) line shows -3. This grid does not include a model with Teff/ log 𝑔/[Fe/H] = 7000/3.0/ − 1.
Current usage metrics show cumulative count of Article Views (full-text article views including HTML views, PDF and ePub downloads, according to the available data) and Abstracts Views on Vision4Press platform.
Data correspond to usage on the plateform after 2015. The current usage metrics is available 48-96 hours after online publication and is updated daily on week days.
Initial download of the metrics may take a while.