Fig. 2

Download original image
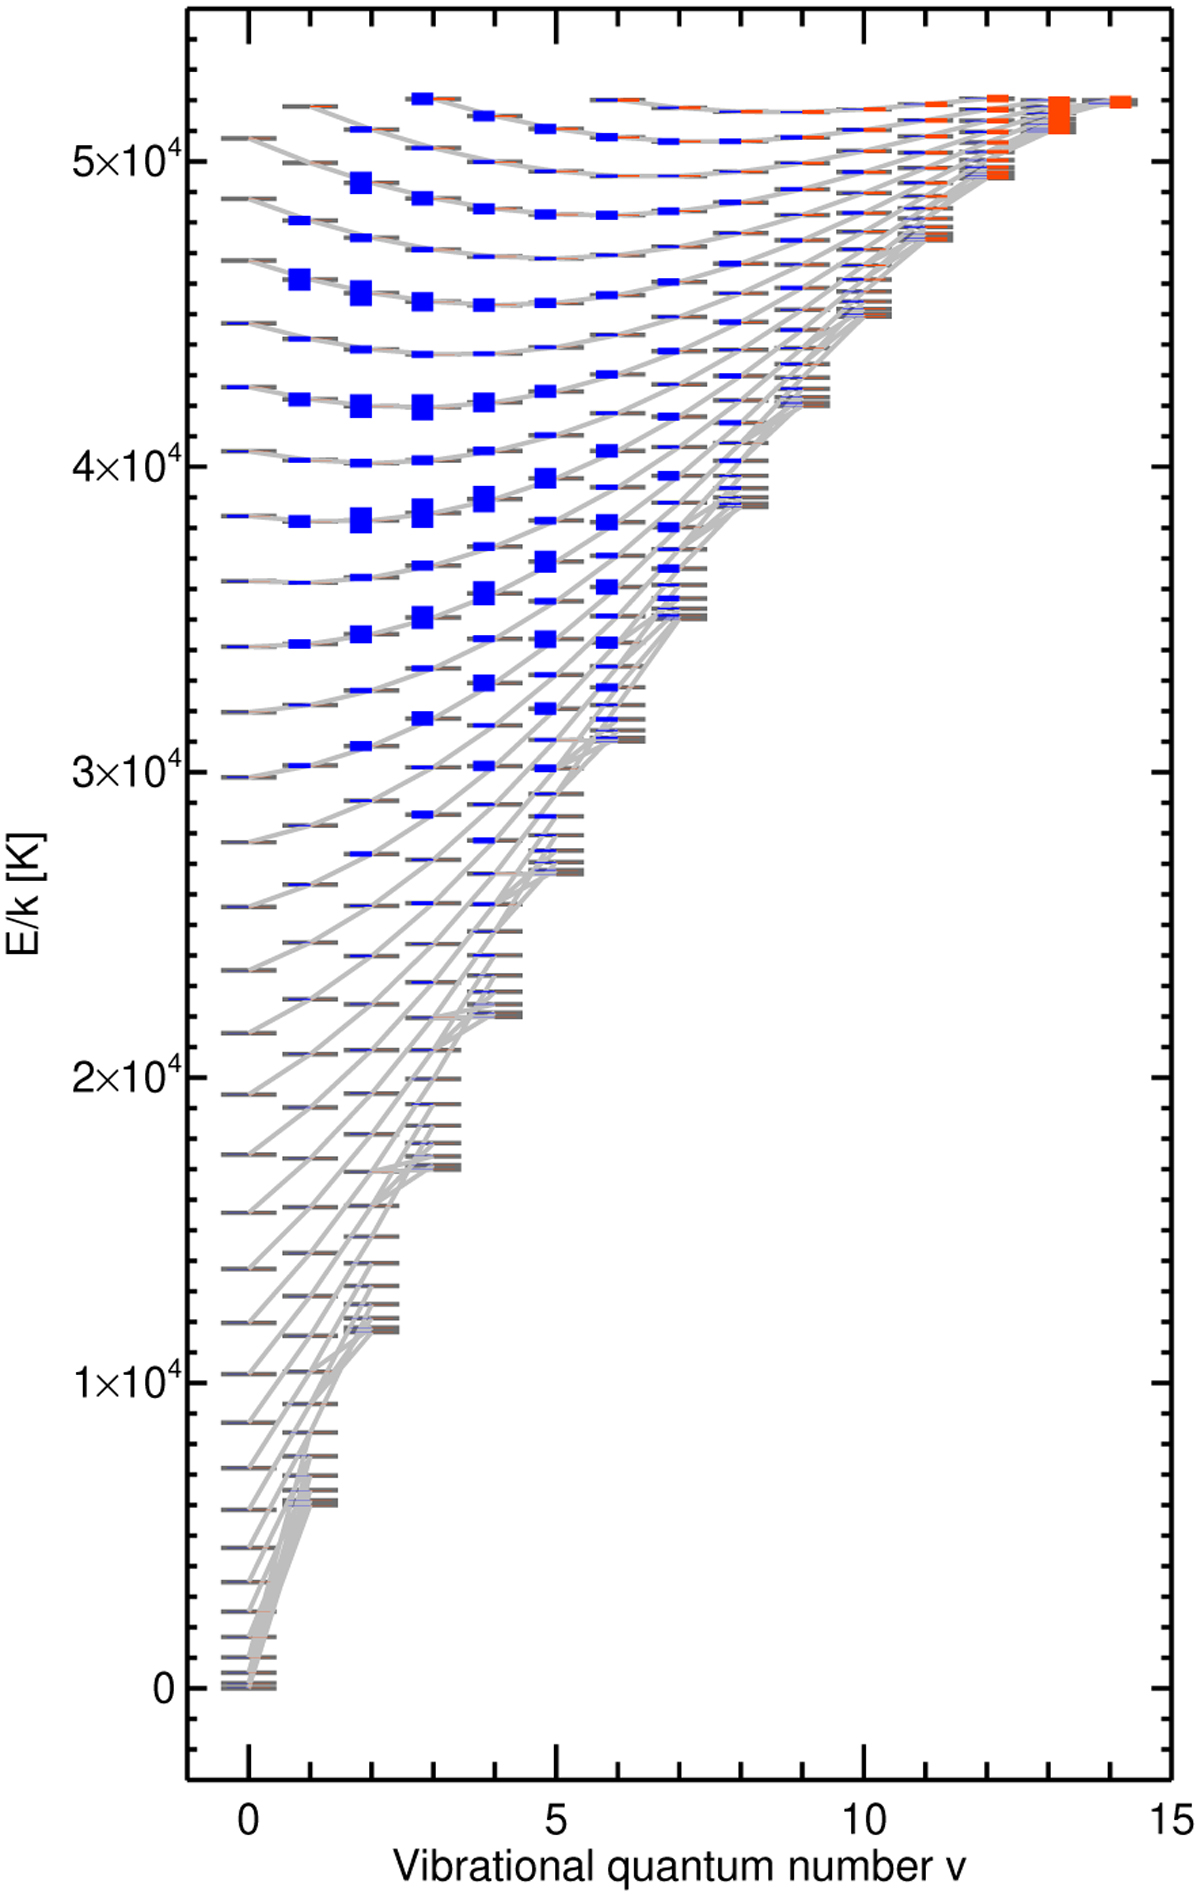
Graphical representation of the efficiency of collision processes on H2 states at 5000 K, shown in terms of state energy on the y-axis and vibrational quantum number v on the x-axis. The left (blue) vertical bar for each state has a height proportional to the associative detachment rate coefficient (H− + H → H2(υ, J) + e) from Launay et al. (1991). The right (orange-red) vertical bar for each state has a height proportional to the collisional dissociation rate coefficient (H2(υ, J) + H → 3H) from Bossion et al. (2018). The length scales are arbitrarily chosen in each case so that the relative proportions can be seen. For each state (υ, J), the de-excitation (most cases) or excitation transition (H2(υ, J) + H → H2(υ′, J′) + H) with the highest rate coefficient k is shown with a grey line; data from Bossion et al. (2018).
Current usage metrics show cumulative count of Article Views (full-text article views including HTML views, PDF and ePub downloads, according to the available data) and Abstracts Views on Vision4Press platform.
Data correspond to usage on the plateform after 2015. The current usage metrics is available 48-96 hours after online publication and is updated daily on week days.
Initial download of the metrics may take a while.


