Fig. 1
Download original image
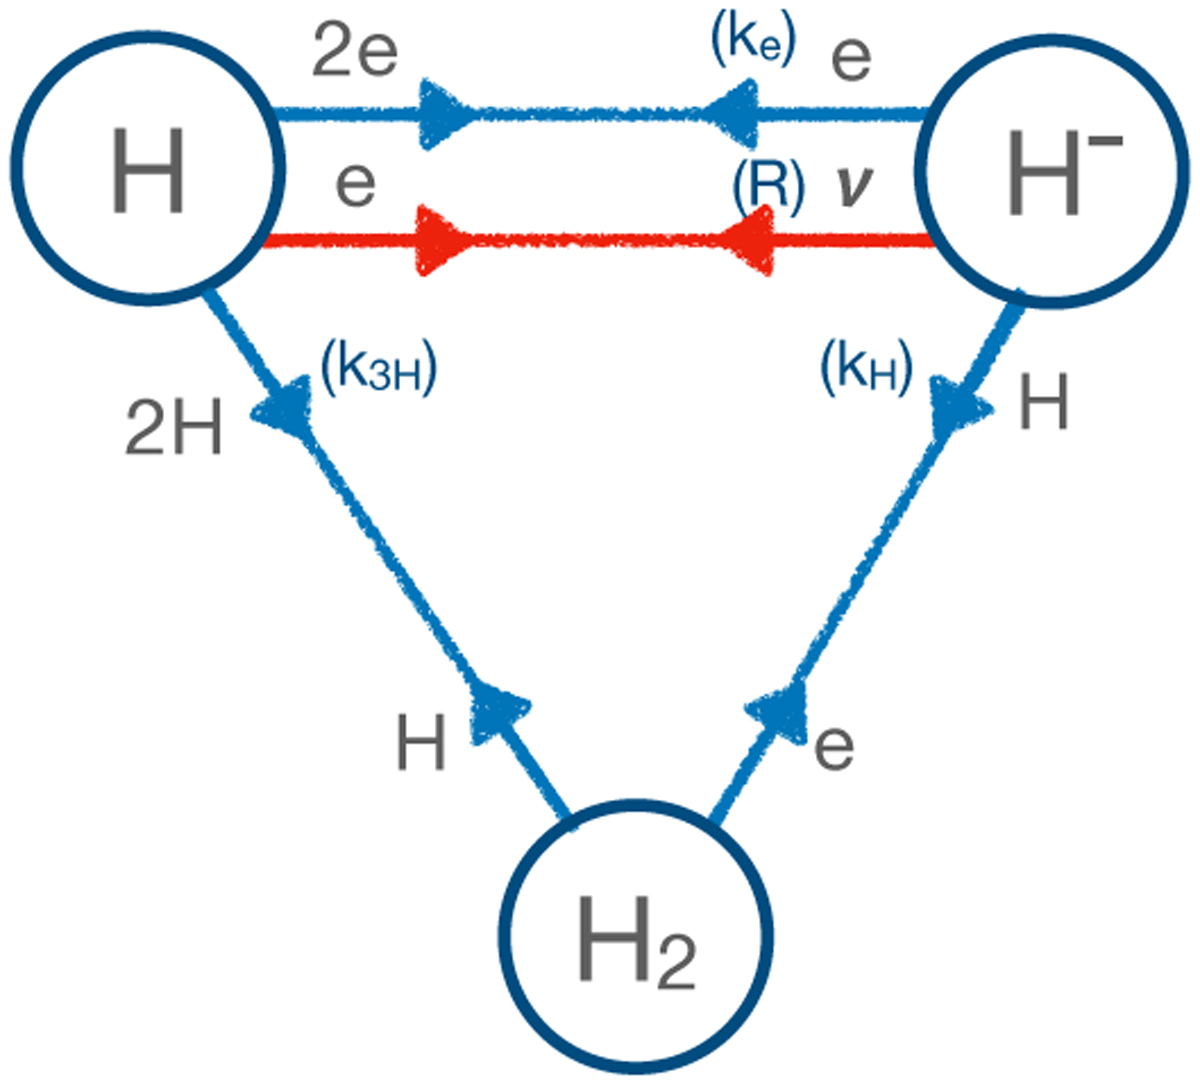
Bubble diagram of the model and the included processes. Collision processes are drawn in blue, and the radiative processes (involving a photon) are drawn in red, where the other particles involved in the process are shown along the relevant line. The corresponding rate coefficients for processes that appear in the model are shown in brackets: R for photodetachment (see Eq. (6) and Sect. 2.1.1), kH for associative detachment (see Sect. 2.1.2), k3H for three-body recombination of hydrogen (see Sect. 2.1.3), and ke for electron collisional detachment (see Sect. 2.1.4).
Current usage metrics show cumulative count of Article Views (full-text article views including HTML views, PDF and ePub downloads, according to the available data) and Abstracts Views on Vision4Press platform.
Data correspond to usage on the plateform after 2015. The current usage metrics is available 48-96 hours after online publication and is updated daily on week days.
Initial download of the metrics may take a while.