Fig. 2
Download original image
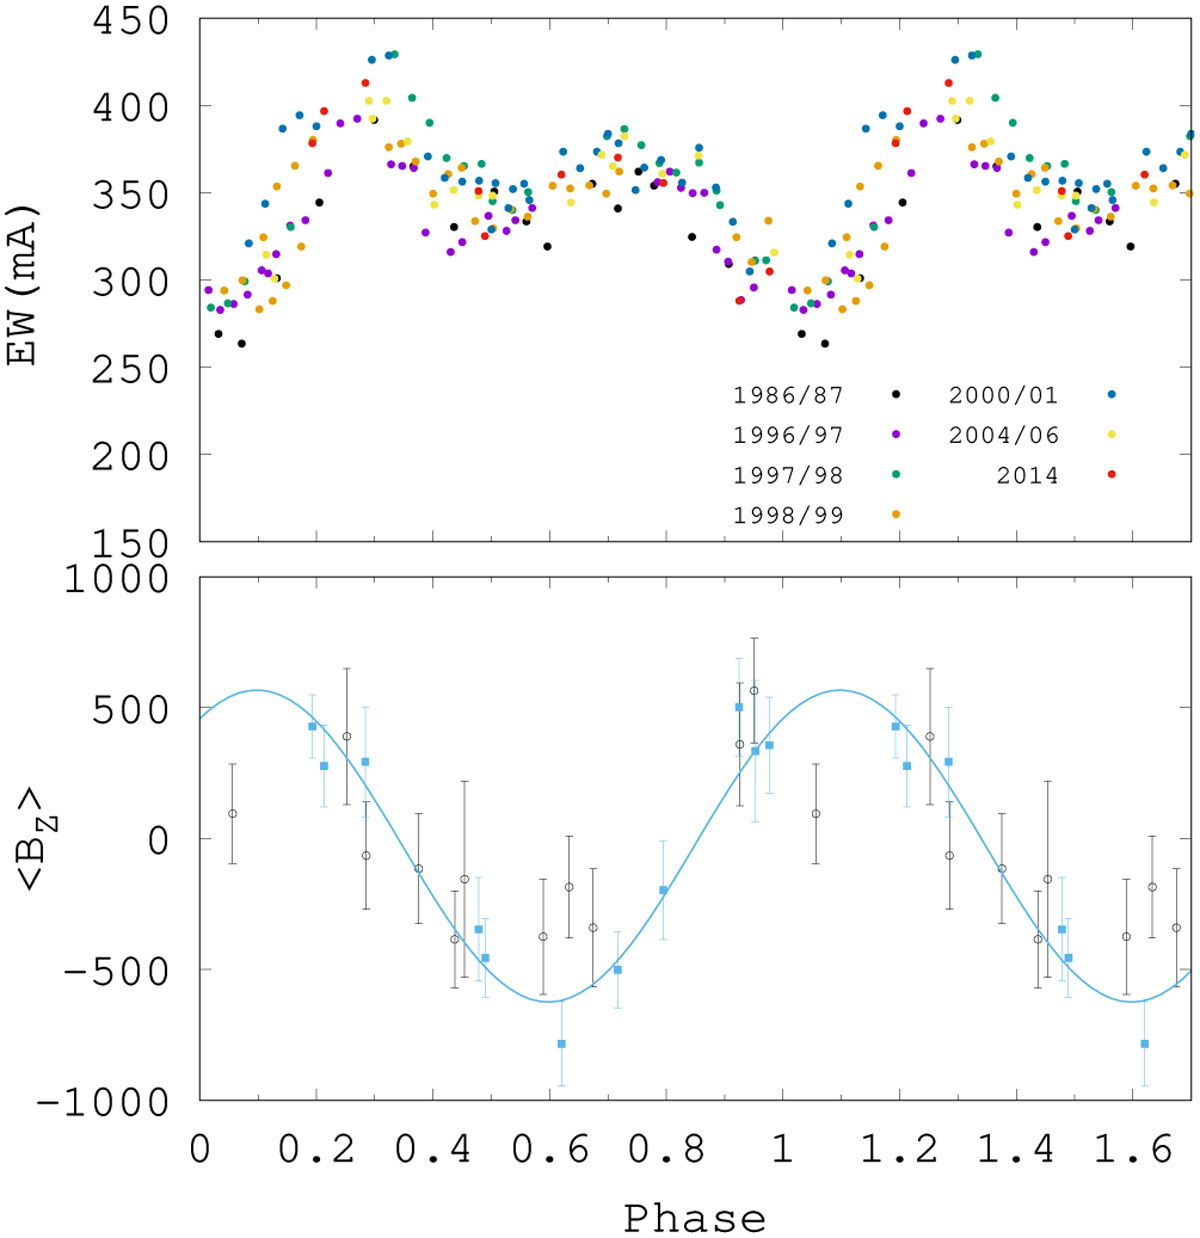
EWs of Si II 6347Å line phased with linear changing period model (Adelman et al. 2001) shown in the top panel. Lower panel gives the variations in the longitudinal magnetic field of 56 Ari according to Borra & Landstreet (1980) as black circles and Shultz et al. (2020) as blue squares, similarly phased to the EW curve. The sinusoidal fit of the magnetic data set is shown by the blue curve.
Current usage metrics show cumulative count of Article Views (full-text article views including HTML views, PDF and ePub downloads, according to the available data) and Abstracts Views on Vision4Press platform.
Data correspond to usage on the plateform after 2015. The current usage metrics is available 48-96 hours after online publication and is updated daily on week days.
Initial download of the metrics may take a while.