Fig. 7
Download original image
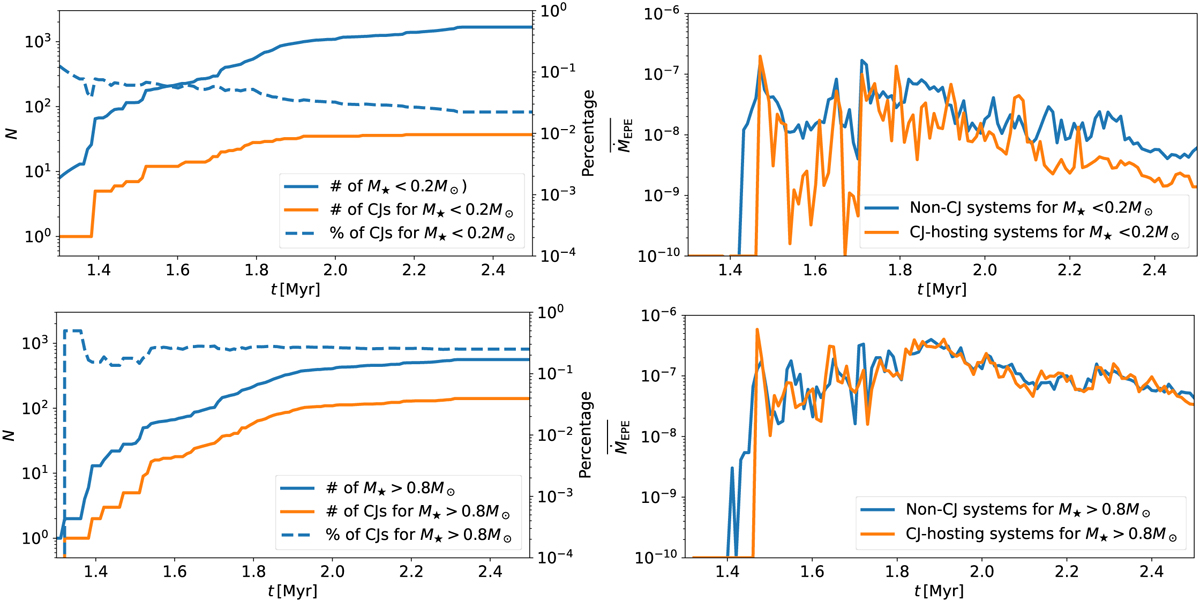
Time evolution of the planet population in the cluster. The top panels illustrate the evolutionary trends of CJ-hosting and non-CJ low-mass systems (<0.2 M⊙), while the lower panels focus on high-mass systems (>0.8 M⊙). The total number of low-mass (<0.2 M⊙) and high-mass (>0.8 M⊙) systems is depicted with blue solid lines in the left panels. Additionally, the left panels display the number of CJ-hosting systems (orange solid line) and the fraction of CJ-hosting systems (blue dashed line). In the right panels, we compare the system-averaged EPE experienced by non-CJ systems (blue line) and CJ-hosting systems (orange line) just before their CJs are formed.
Current usage metrics show cumulative count of Article Views (full-text article views including HTML views, PDF and ePub downloads, according to the available data) and Abstracts Views on Vision4Press platform.
Data correspond to usage on the plateform after 2015. The current usage metrics is available 48-96 hours after online publication and is updated daily on week days.
Initial download of the metrics may take a while.