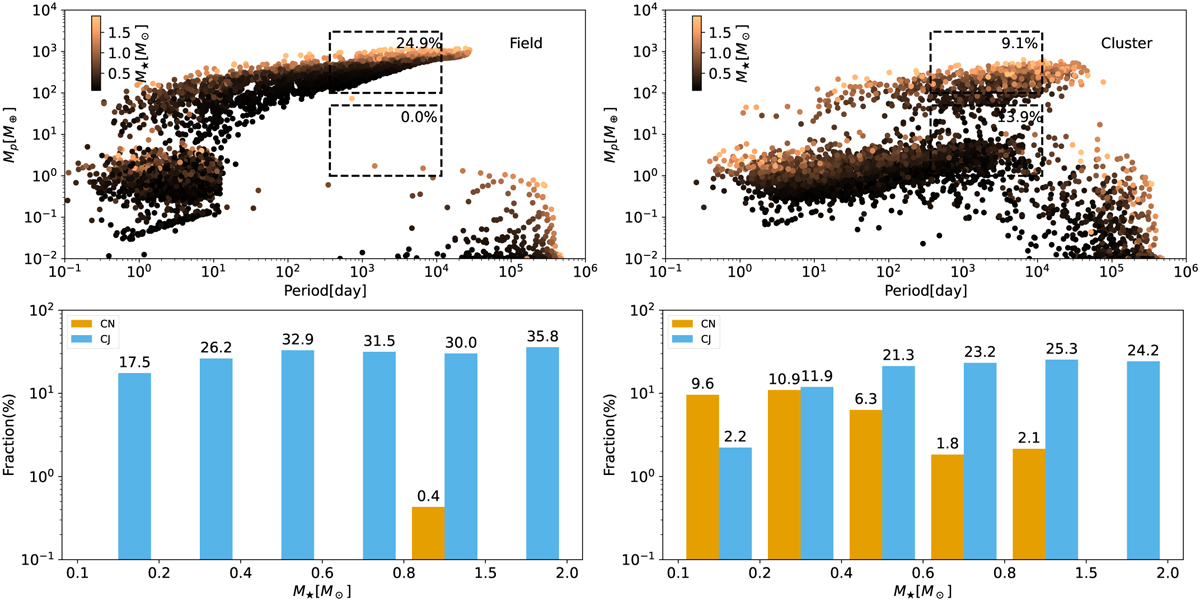
Fig. 6
Download original image
Planet population for isolated stars (left panels) and stars in the cluster (right panels). The initial condition is identical in the two scenarios, while proto-planet disks around stars in the cluster are more massively photo-evaporated during their evolution. In the upper panels, the position of the scatter represents the planetary orbital period and mass at the end of the simulation. The color denotes the host mass. The upper and lower black dashed boxes indicate the boundaries of Jupiter-like and Neptune-like planets, with the associated synthetic fraction labeled. In the lower panels, we separate the occurrence rate of cold Jupiter (blue bar) and cold Neptune (yellow bar) into different host mass ranges.
Current usage metrics show cumulative count of Article Views (full-text article views including HTML views, PDF and ePub downloads, according to the available data) and Abstracts Views on Vision4Press platform.
Data correspond to usage on the plateform after 2015. The current usage metrics is available 48-96 hours after online publication and is updated daily on week days.
Initial download of the metrics may take a while.