Fig. 4
Download original image
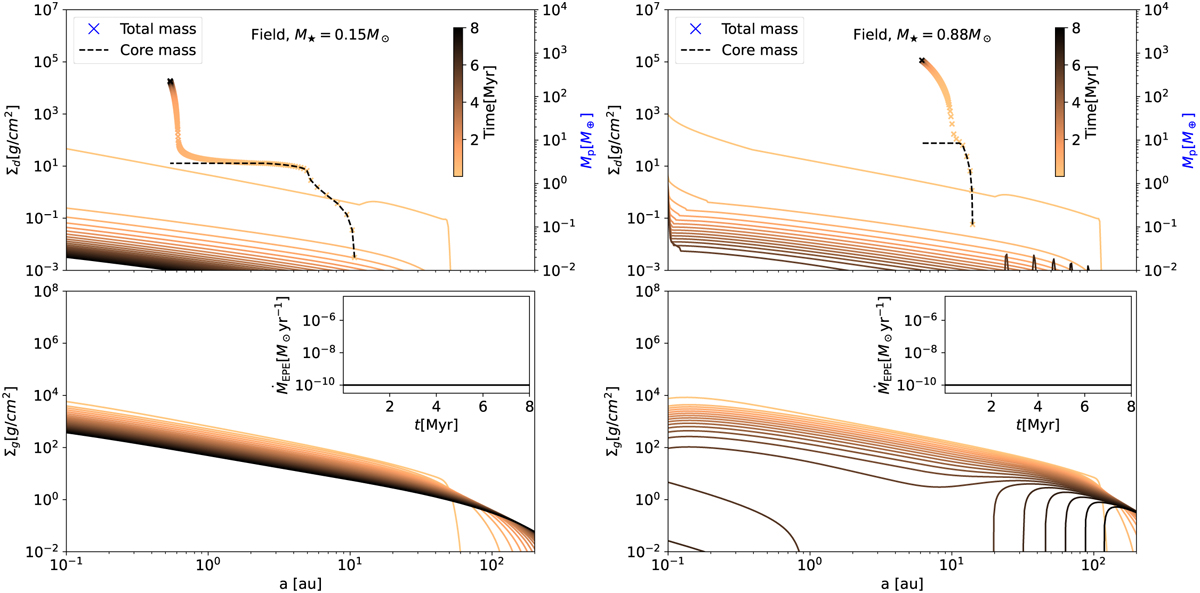
Comparison of disk evolution and planet growth tracks between a low-mass star (0.15 M⊙, left panels) and a relatively high-mass star (0.88 M⊙, right panels) in an isolated environment (ṀEPE = 10−10 M⊙ yr−1 ). In the top panels, we display the evolution of dust surface density (left axis) alongside planet mass (right axis). The planet’s total mass and core mass are tracked separately using cross dots and dashed lines, respectively. The bottom panels show the evolution of gas surface density. The inset in the top right corner illustrates the history of external photo-evaporation rates experienced by the system. Both the top and bottom panels in each column share the same color bar, indicating the age of the system.
Current usage metrics show cumulative count of Article Views (full-text article views including HTML views, PDF and ePub downloads, according to the available data) and Abstracts Views on Vision4Press platform.
Data correspond to usage on the plateform after 2015. The current usage metrics is available 48-96 hours after online publication and is updated daily on week days.
Initial download of the metrics may take a while.