Fig. 3
Download original image
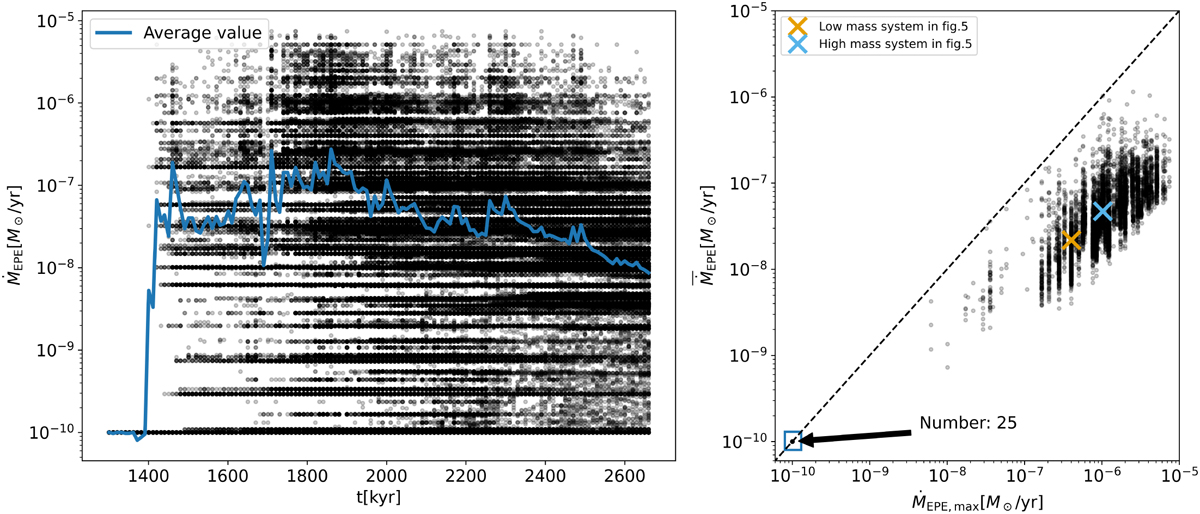
External photo-evaporation rate of disks in the cluster. The left panel shows the external photo-evaporation rate of each disk (black dots) and the averaged values over all disks (blue line) at different simulation times. The right panel shows the maximum external photo-evaporation rate versus the averaged value over the cluster lifetime of each disk. We also indicate the location and the number of isolated stars with their external photo-evaporation rates remaining at the lowest limit. In addition, the yellow and blue crosses display low- and high-mass systems, which are discussed further in Sect. 4.1.
Current usage metrics show cumulative count of Article Views (full-text article views including HTML views, PDF and ePub downloads, according to the available data) and Abstracts Views on Vision4Press platform.
Data correspond to usage on the plateform after 2015. The current usage metrics is available 48-96 hours after online publication and is updated daily on week days.
Initial download of the metrics may take a while.