Fig. A.1
Download original image
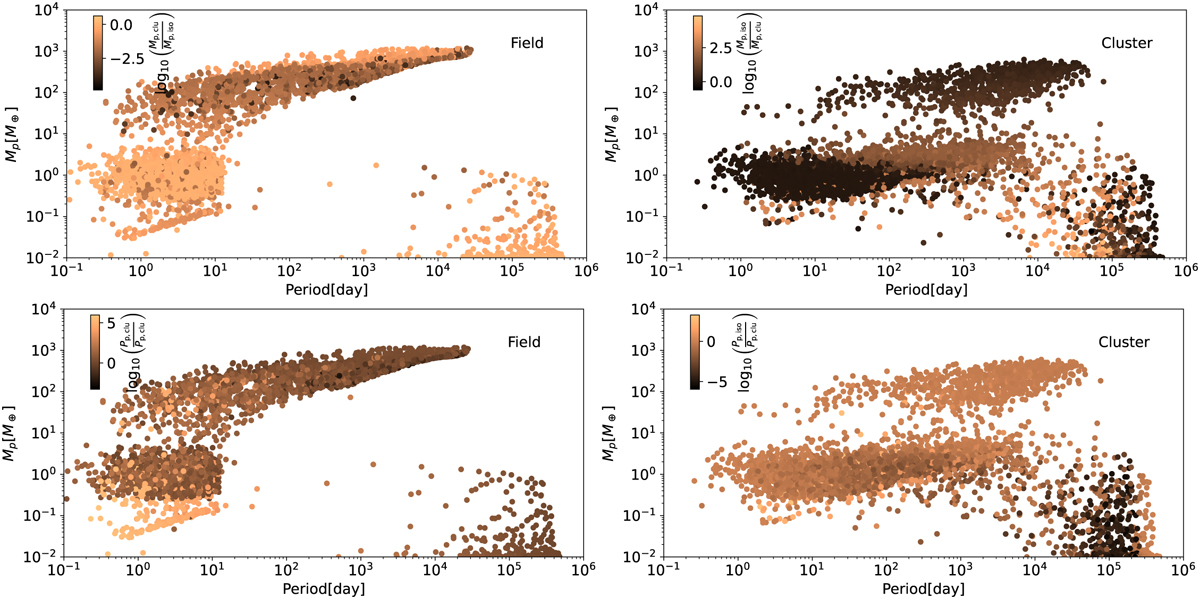
Similar to the upper panels of Fig. 6, but with colors indicating different properties. In the upper left panel, the color shows the logarithmic value of the mass ratio of planets in the cluster to those in isolation. In the upper right panel, it shows the opposite: the mass ratio of planets in isolation to those in the cluster. In the lower panels, the colors represent the logarithmic value of the period ratio of planets. The lower left shows the period ratio of planets in isolation to those in the cluster, while the lower right shows the period ratio of planets in the cluster to those in isolation.
Current usage metrics show cumulative count of Article Views (full-text article views including HTML views, PDF and ePub downloads, according to the available data) and Abstracts Views on Vision4Press platform.
Data correspond to usage on the plateform after 2015. The current usage metrics is available 48-96 hours after online publication and is updated daily on week days.
Initial download of the metrics may take a while.