Fig. 8
Download original image
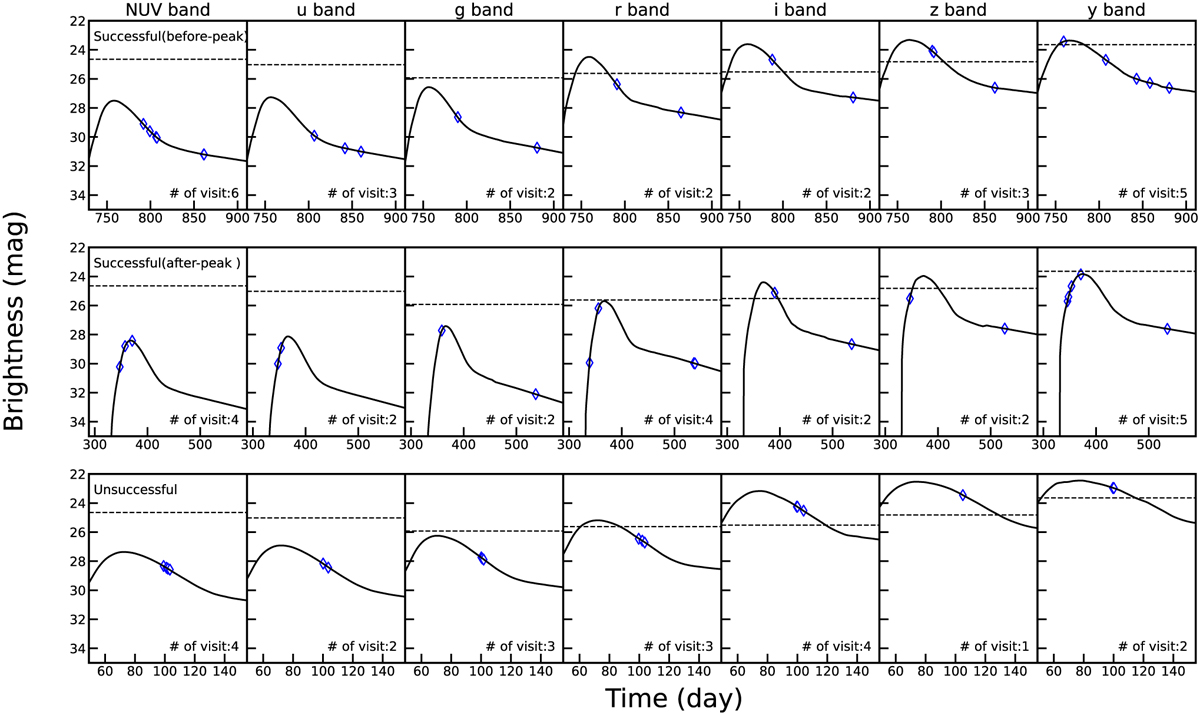
Examples of successful and unsuccessful strongly lensed SNe discoveries in the WFS. From top to bottom, a successful before-peak discovery, a successful after-peak discovery, and an unsuccessful discovery are shown. The seven panels in each row correspond to light curves of the first arrival SN image in the seven CSST bands. The blue symbols indicate the time this system is visited by the CSST. The dashed line in each panel represents the single-visit limiting magnitude in that band.
Current usage metrics show cumulative count of Article Views (full-text article views including HTML views, PDF and ePub downloads, according to the available data) and Abstracts Views on Vision4Press platform.
Data correspond to usage on the plateform after 2015. The current usage metrics is available 48-96 hours after online publication and is updated daily on week days.
Initial download of the metrics may take a while.