Open Access
Fig. 2
Download original image
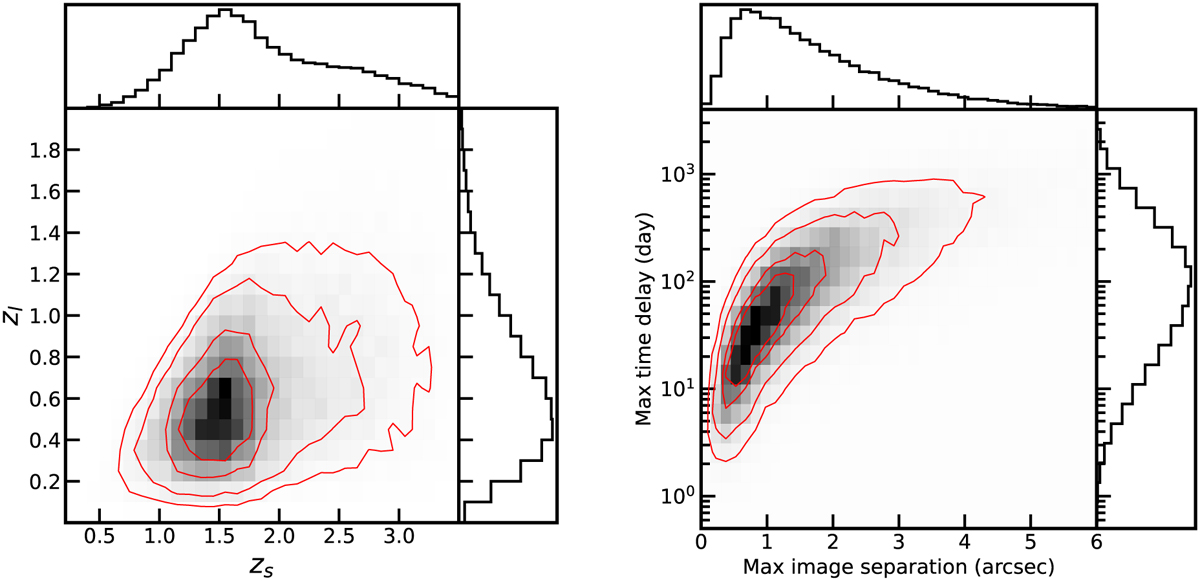
Selected properties of strongly lensed SNe from our mock catalog. Left: two-dimensional distributions of the lens and source (i.e., SN) redshifts. Right: two-dimensional distributions of the maximum image separation and the maximum relative time delay. The red contours enclose 20%, 35%, 65% and 85% of the full sample.
Current usage metrics show cumulative count of Article Views (full-text article views including HTML views, PDF and ePub downloads, according to the available data) and Abstracts Views on Vision4Press platform.
Data correspond to usage on the plateform after 2015. The current usage metrics is available 48-96 hours after online publication and is updated daily on week days.
Initial download of the metrics may take a while.