Open Access
Fig. B.1
Download original image
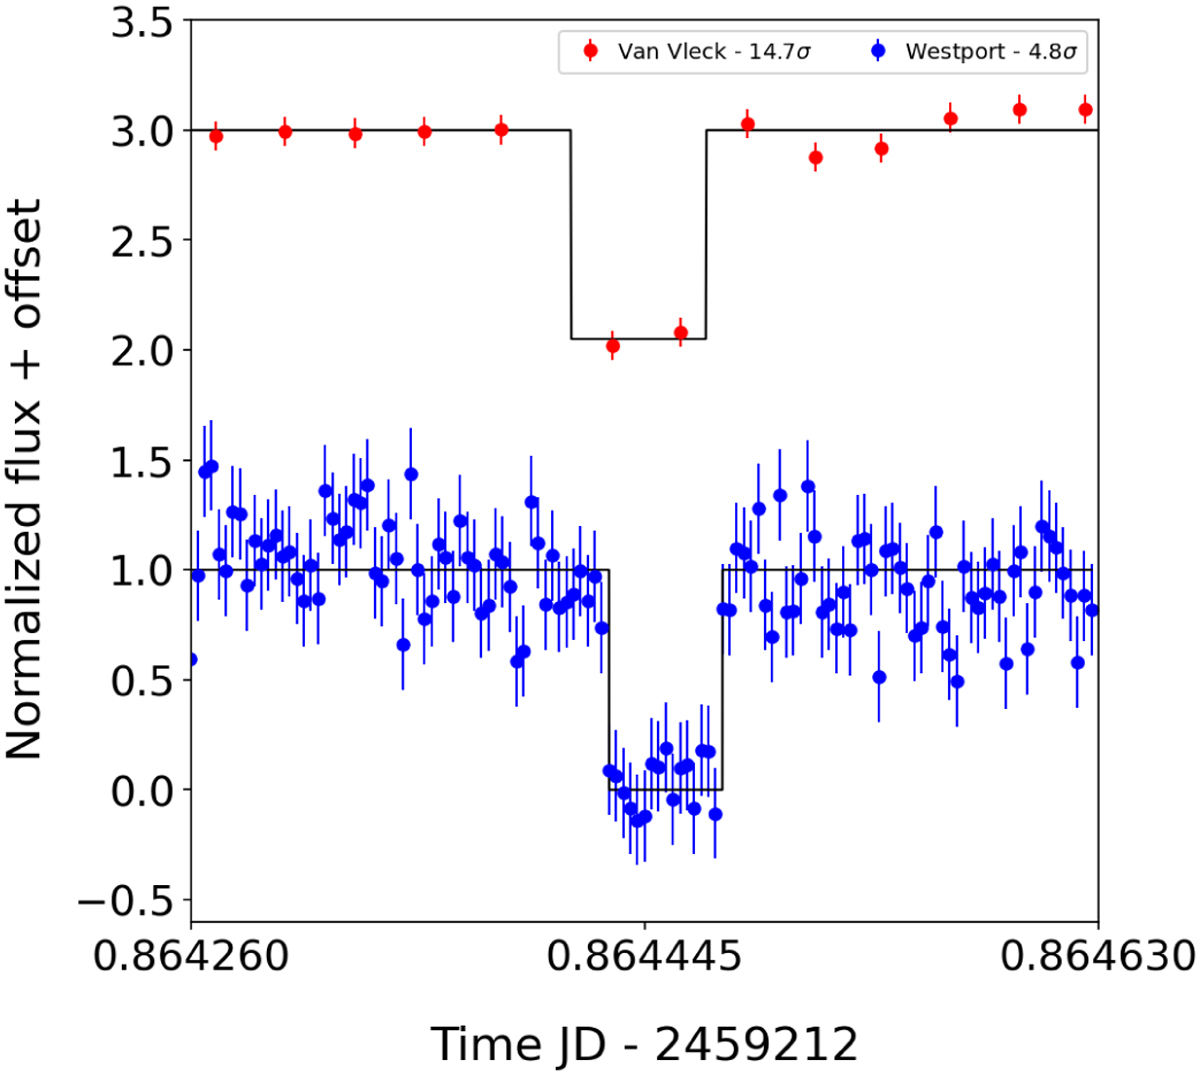
Normalized flux value (with offset for better visualization) obtained from the two observations made during Occ. A on February 6, 2022. The observations present a flux drop of 17.4σ for Van Vleck (red) and 4.8σ for Westport (blue). The black line represents a square well fit to the observational data.
Current usage metrics show cumulative count of Article Views (full-text article views including HTML views, PDF and ePub downloads, according to the available data) and Abstracts Views on Vision4Press platform.
Data correspond to usage on the plateform after 2015. The current usage metrics is available 48-96 hours after online publication and is updated daily on week days.
Initial download of the metrics may take a while.