Fig. 7
Download original image
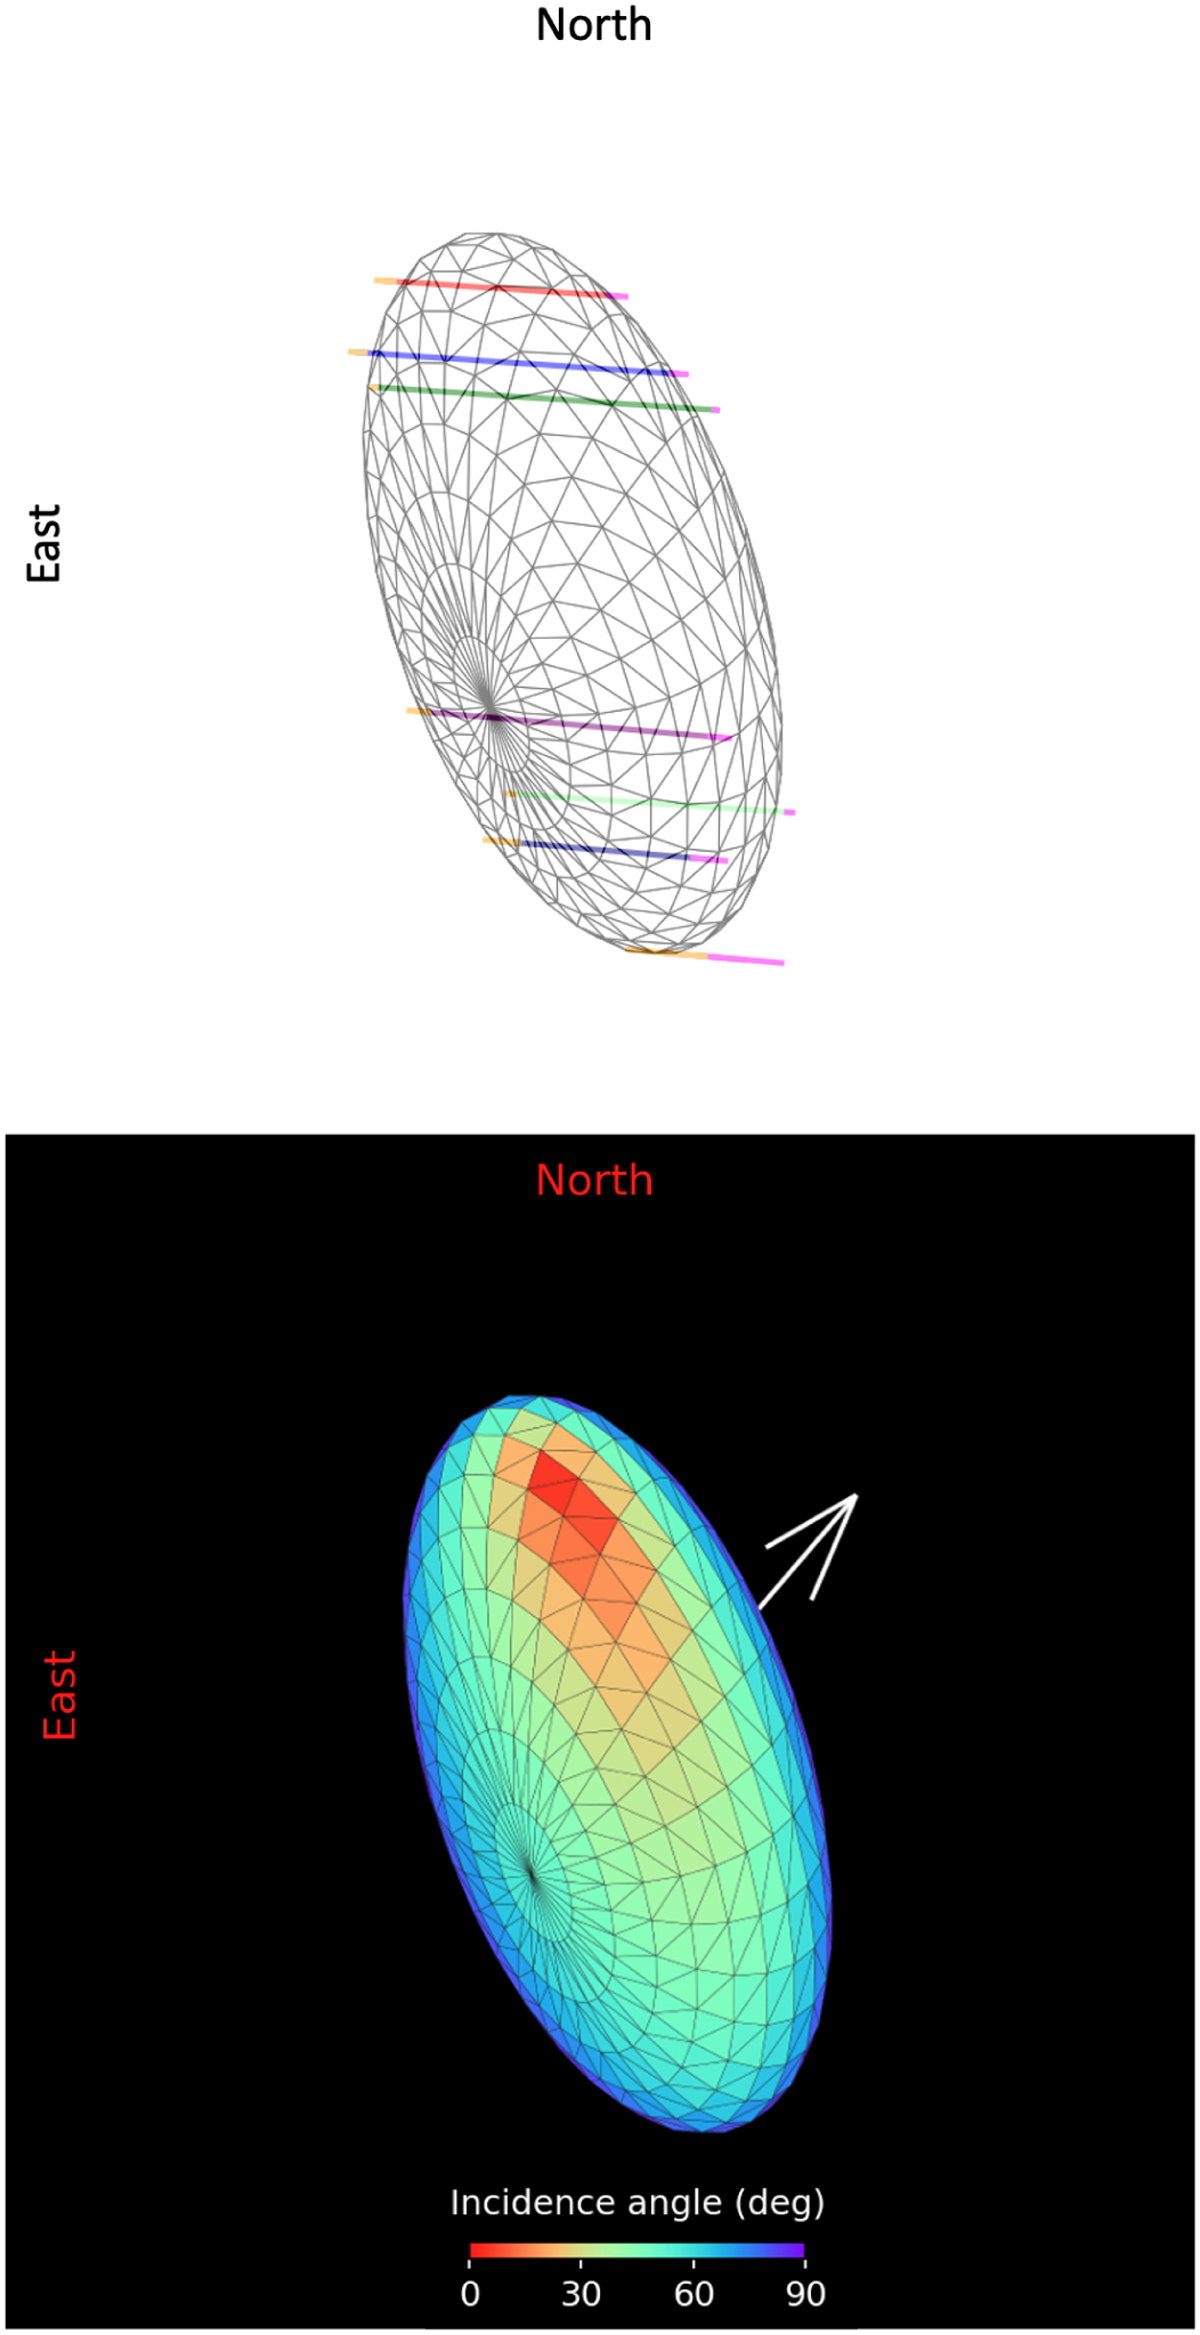
Bienor shape model as observed from Earth during Occ. B at a rotational phase of 0.15. The top panel showcases chords from Occ. B overlaid onto the shape model, demonstrating that the shape of the projected ellipse corresponds closely to the least-squares fitted ellipse outlined in Section 3.1. The bottom panel shows the same but with coloring. The colors denote the solar incidence angle. The white arrow points toward the rotation pole.
Current usage metrics show cumulative count of Article Views (full-text article views including HTML views, PDF and ePub downloads, according to the available data) and Abstracts Views on Vision4Press platform.
Data correspond to usage on the plateform after 2015. The current usage metrics is available 48-96 hours after online publication and is updated daily on week days.
Initial download of the metrics may take a while.