Open Access
Fig. 6
Download original image
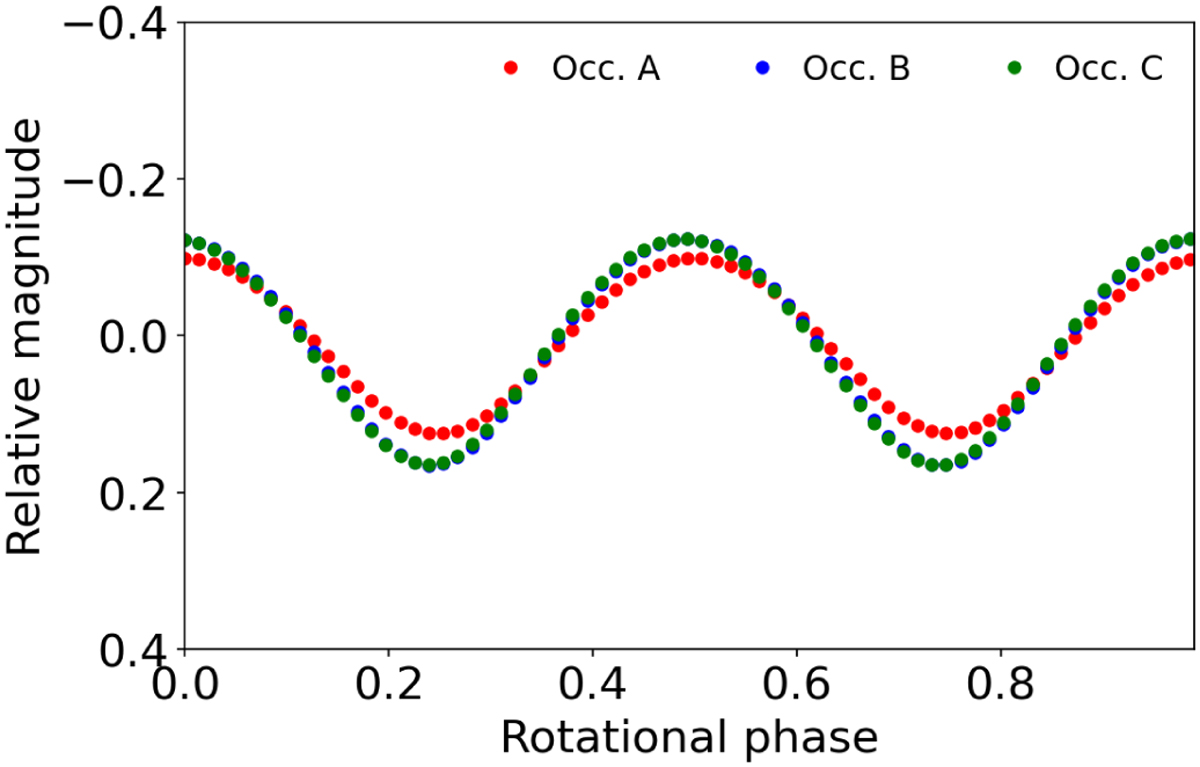
Synthetic rotational light curve generated for Bienor as observed from Earth during Occ. A, B, and C. The light curve was sampled at intervals of 5 degrees. Animations depicting the rotation of Bienor can be accessed online.
Current usage metrics show cumulative count of Article Views (full-text article views including HTML views, PDF and ePub downloads, according to the available data) and Abstracts Views on Vision4Press platform.
Data correspond to usage on the plateform after 2015. The current usage metrics is available 48-96 hours after online publication and is updated daily on week days.
Initial download of the metrics may take a while.