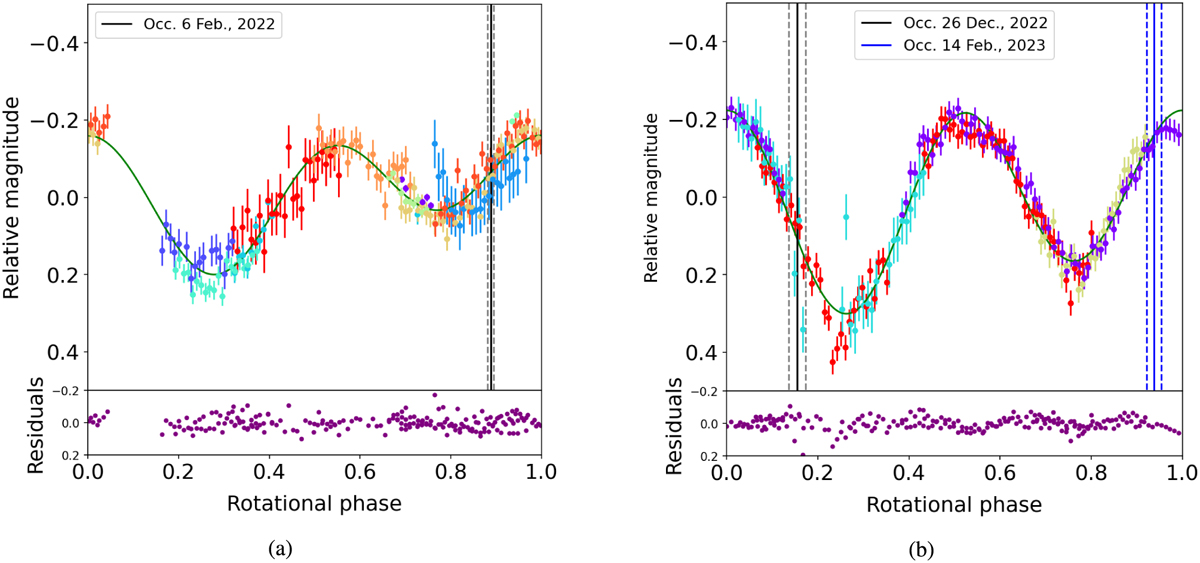
Fig. 4
Download original image
Rotational light curves of Bienor. In (a), we present the rotational light curve using 2021 data, while (b) shows the 2023 observational data. The vertical line indicates the rotational phase during Occ. A, B, and C, respectively. In both panels, the dashed lines show the uncertainty after studying how the 0.0002 h error propagates with time. A unique color represents each observation day. At the bottom, the difference (residual) between the modeled curve and the observational data is shown.
Current usage metrics show cumulative count of Article Views (full-text article views including HTML views, PDF and ePub downloads, according to the available data) and Abstracts Views on Vision4Press platform.
Data correspond to usage on the plateform after 2015. The current usage metrics is available 48-96 hours after online publication and is updated daily on week days.
Initial download of the metrics may take a while.