Fig. D.2
Download original image
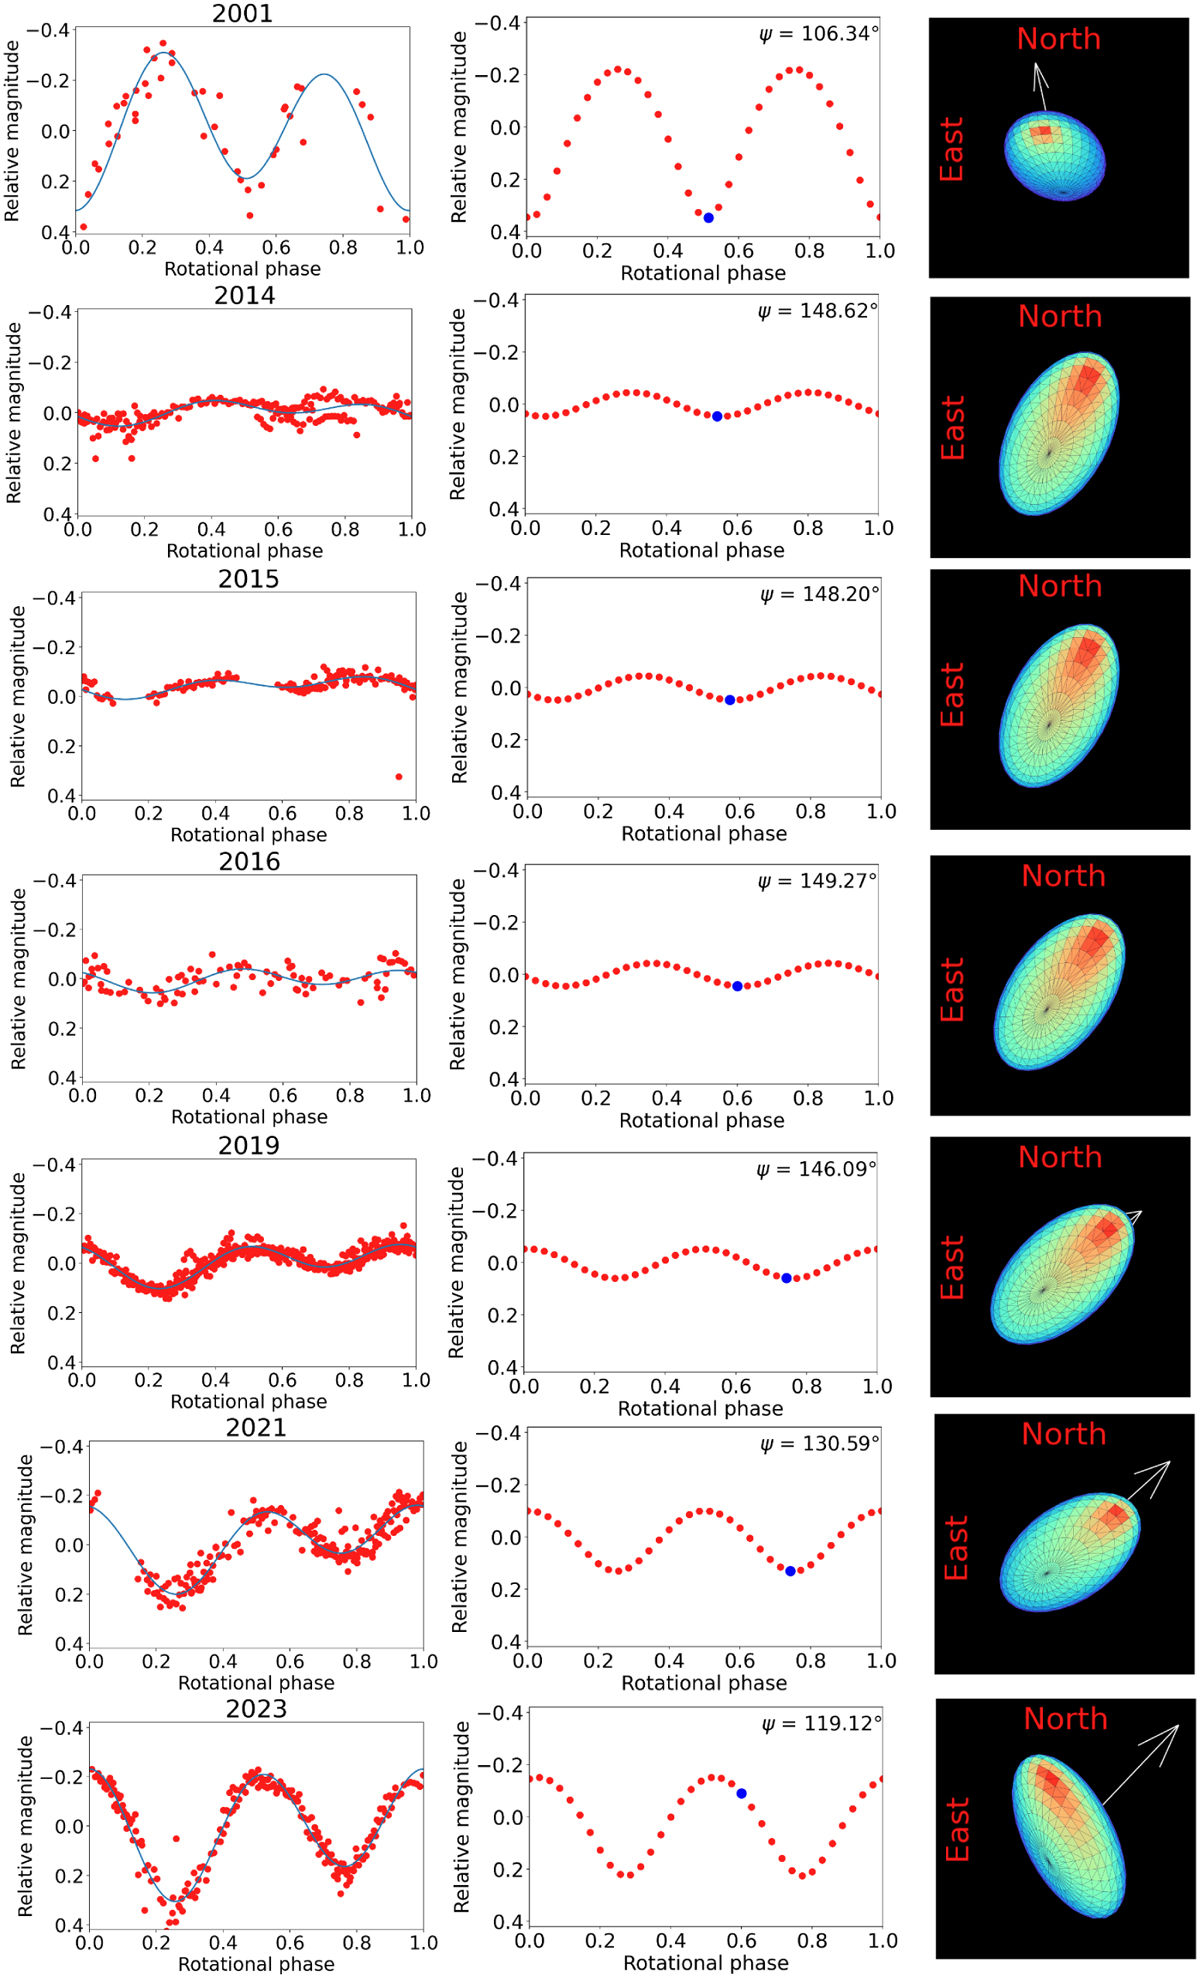
Left column: rotational light curves observed since 2001 (Ortiz et al. 2002; Fernández-Valenzuela et al. 2017, 2023). Julian date has been corrected for light travel time and phased using the refined period of 9.1736 h. Middle column: synthetic rotational light curves for a triaxial ellipsoid (b/a = 0.45, c/b = 0.79) using the prograde sense of rotation (Fernández-Valenzuela et al. 2017) generated by our software. At the upper right corner of each plot, the value of the aspect angle is displayed. The resulting backplanes and radiance are sampled with a 10-degree step. Right column: shape model as seen from Earth at the minimum brightness of the synthetic rotational light curve. The colors indicate the value of the solar incidence angle, following the same scale shown in Fig. 7. The white arrow points toward the rotation pole. The blue dot in the middle plots indicates the point that corresponds to the image on the right.
Current usage metrics show cumulative count of Article Views (full-text article views including HTML views, PDF and ePub downloads, according to the available data) and Abstracts Views on Vision4Press platform.
Data correspond to usage on the plateform after 2015. The current usage metrics is available 48-96 hours after online publication and is updated daily on week days.
Initial download of the metrics may take a while.