Fig. C.3
Download original image
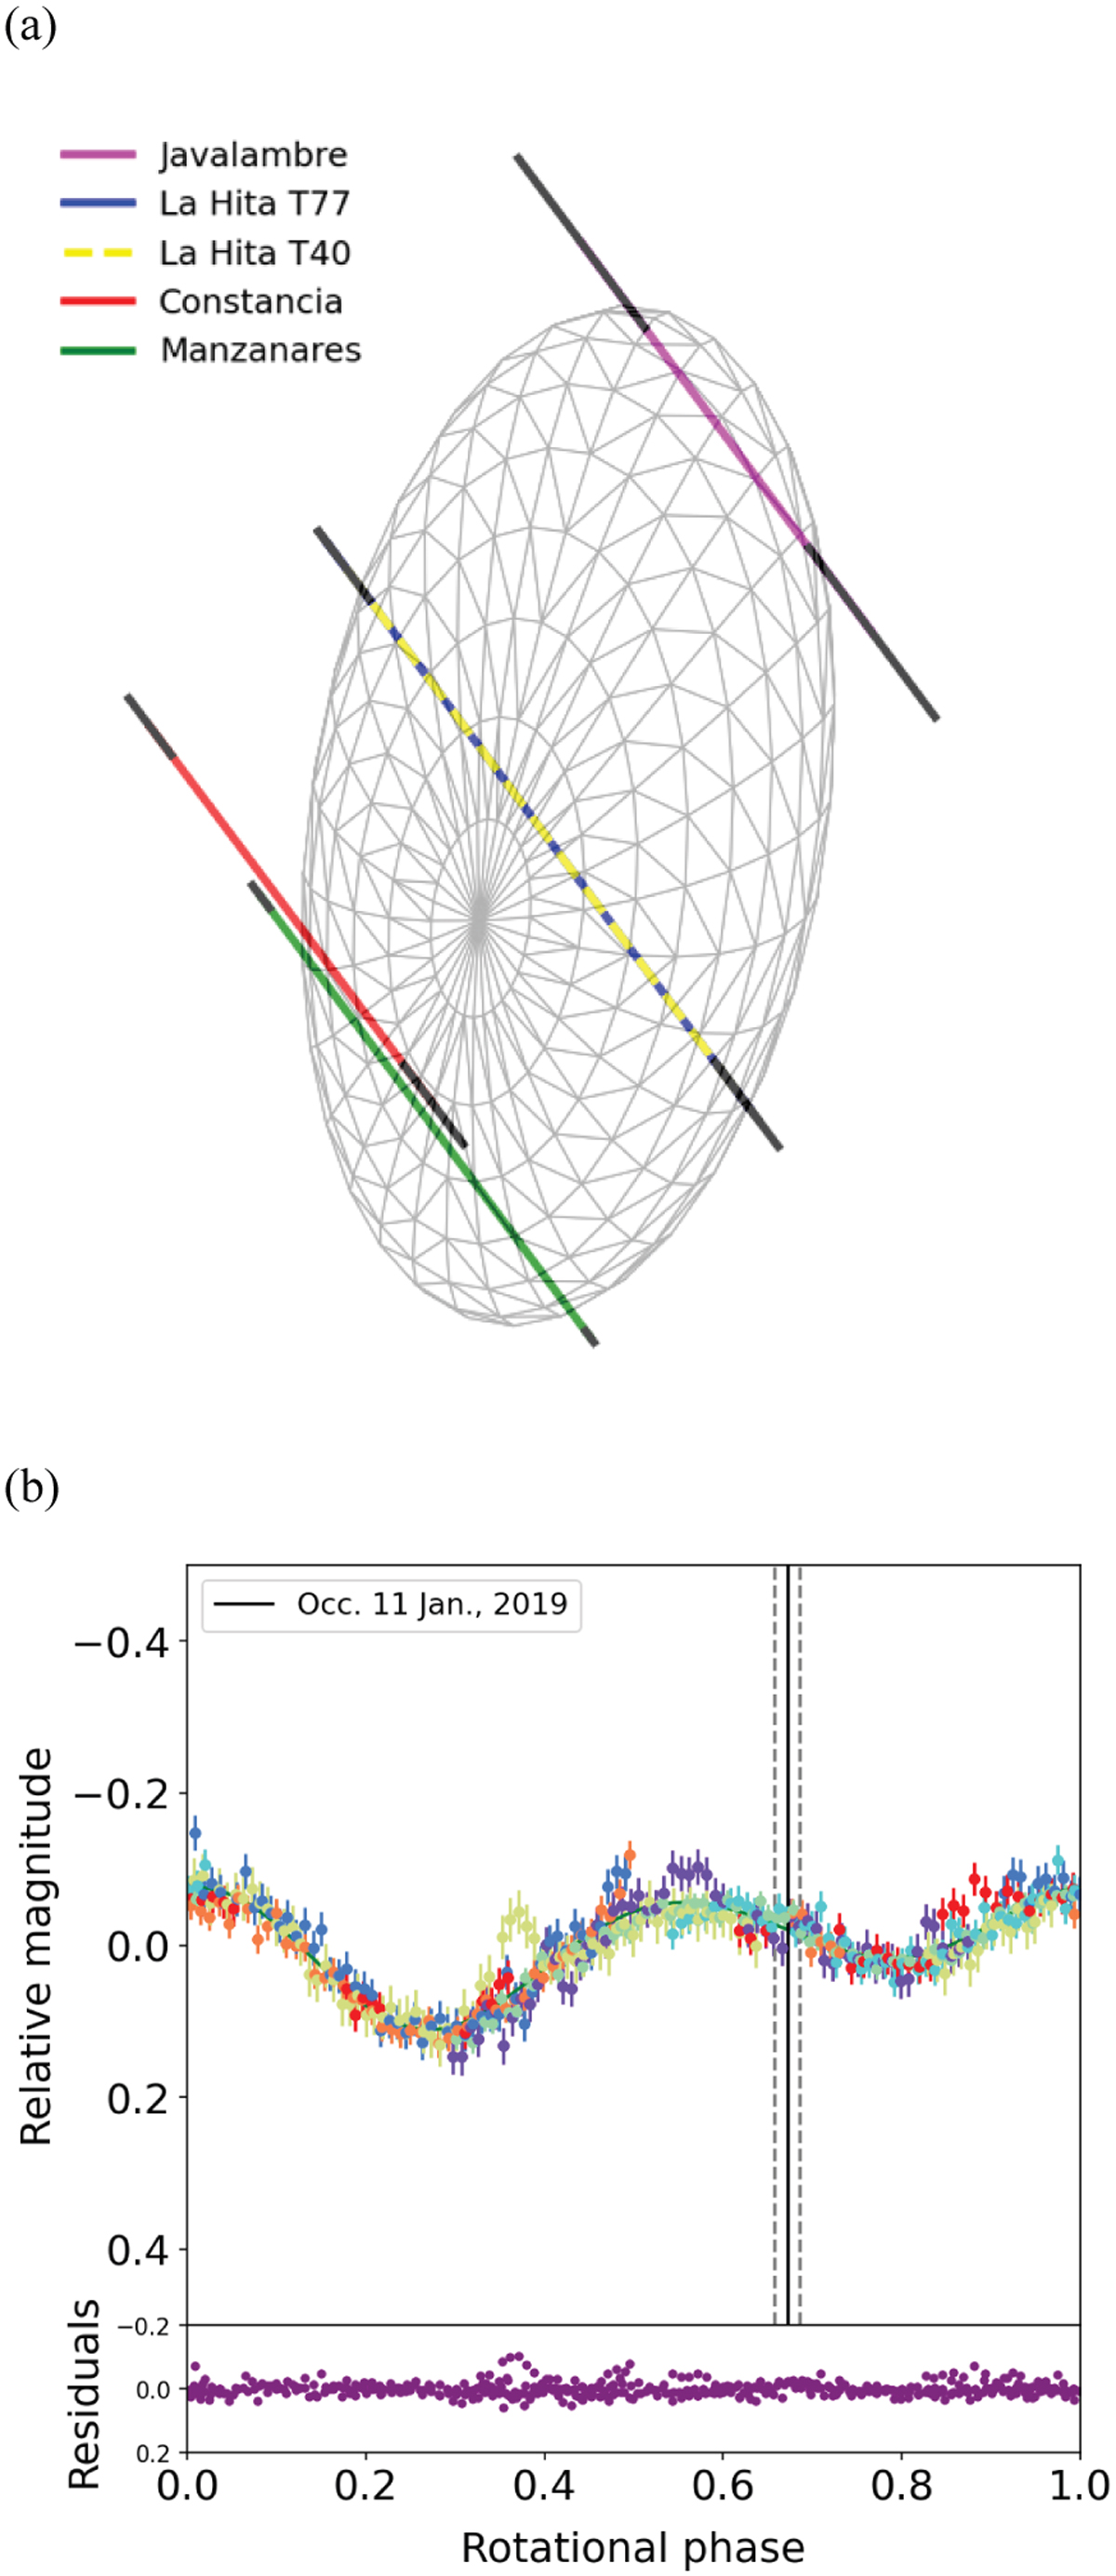
a) Shape model of Bienor, as seen from Earth on January 11, 2019, at 01:03:30 UT, with the chords of the occultation observed at that time and analyzed by Fernández-Valenzuela et al. (2023). The authors found synchronization issues between the Manzanares and Constancia chords. Now it becomes evident that it is the Constancia chord (red) that had to be corrected. b) Rotational light curve using observational data from 2019 as reported by Fernández-Valenzuela et al. (2023). With the newly refined period from this work, the rotational phase was 0.67 ± 0.015. Dashed lines show the uncertainty after studying how the 0.0002 h error propagates with time. A unique color represents each observation day. At the bottom, it is shown the difference (residual) between the modeled curve and the observational data.
Current usage metrics show cumulative count of Article Views (full-text article views including HTML views, PDF and ePub downloads, according to the available data) and Abstracts Views on Vision4Press platform.
Data correspond to usage on the plateform after 2015. The current usage metrics is available 48-96 hours after online publication and is updated daily on week days.
Initial download of the metrics may take a while.