Fig. 1
Download original image
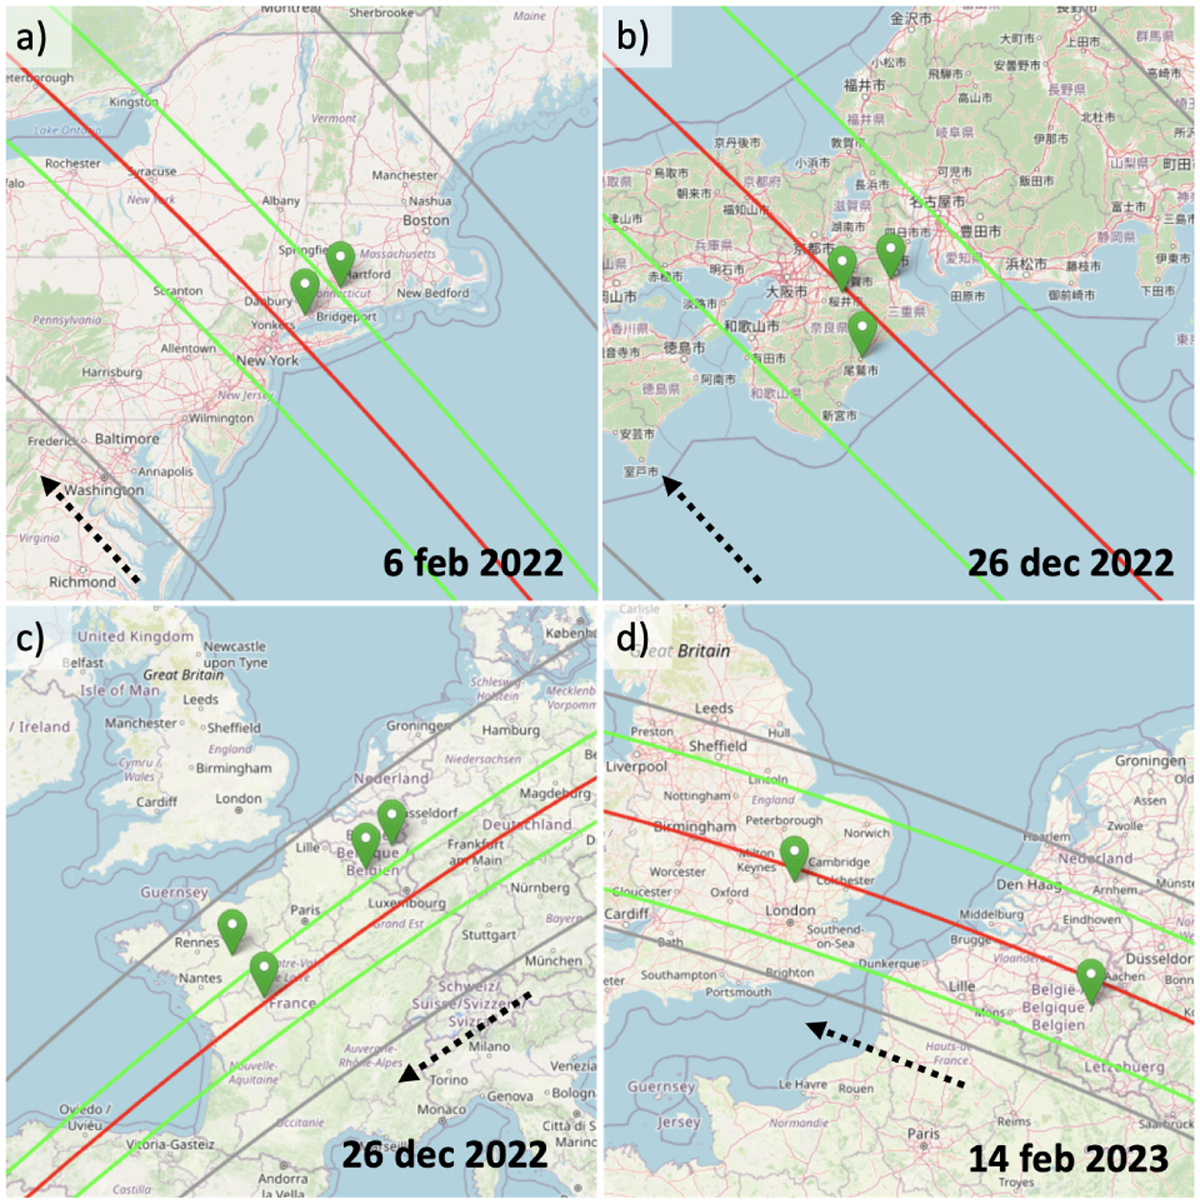
Predicted occultation shadow path computed for February 6, 2022 (a), December 26, 2022 (b & c), and February 14, 2023 (d). Green lines depict the boundaries of the shadow paths, while the gray lines represent the uncertainty in the path resulting from orbital uncertainties. A red line denotes the center of the shadow path, and the pins indicate the positions of the stations involved in the campaigns. Green pins signify sites where a positive occultation was observed. The maps were generated using OpenStreetMap via the Occultation Portal. The dotted arrow denotes the shadow’s direction of motion.
Current usage metrics show cumulative count of Article Views (full-text article views including HTML views, PDF and ePub downloads, according to the available data) and Abstracts Views on Vision4Press platform.
Data correspond to usage on the plateform after 2015. The current usage metrics is available 48-96 hours after online publication and is updated daily on week days.
Initial download of the metrics may take a while.