Open Access
Fig. 9
Download original image
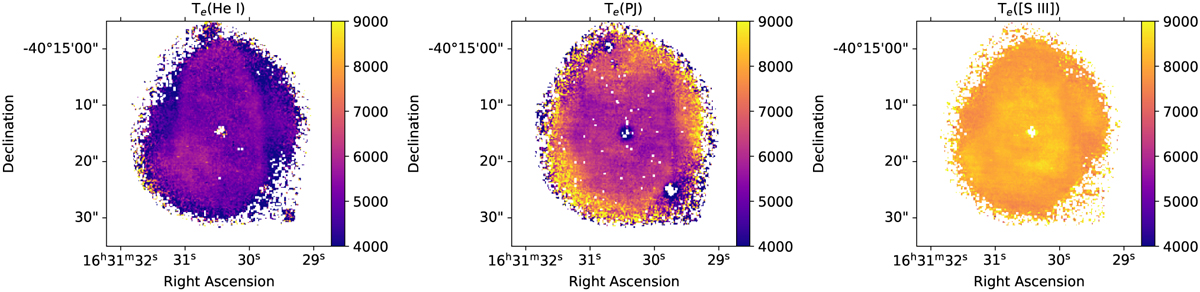
Temperature maps obtained from He I lines (left panel), from the ratio of the Paschen jump to H I P9 (central panel), and from the [S III] λ6312/λ9069 CEL ratio (right panel). The Te scale is the same in all panels to better appreciate the differences.
Current usage metrics show cumulative count of Article Views (full-text article views including HTML views, PDF and ePub downloads, according to the available data) and Abstracts Views on Vision4Press platform.
Data correspond to usage on the plateform after 2015. The current usage metrics is available 48-96 hours after online publication and is updated daily on week days.
Initial download of the metrics may take a while.