Fig. 7
Download original image
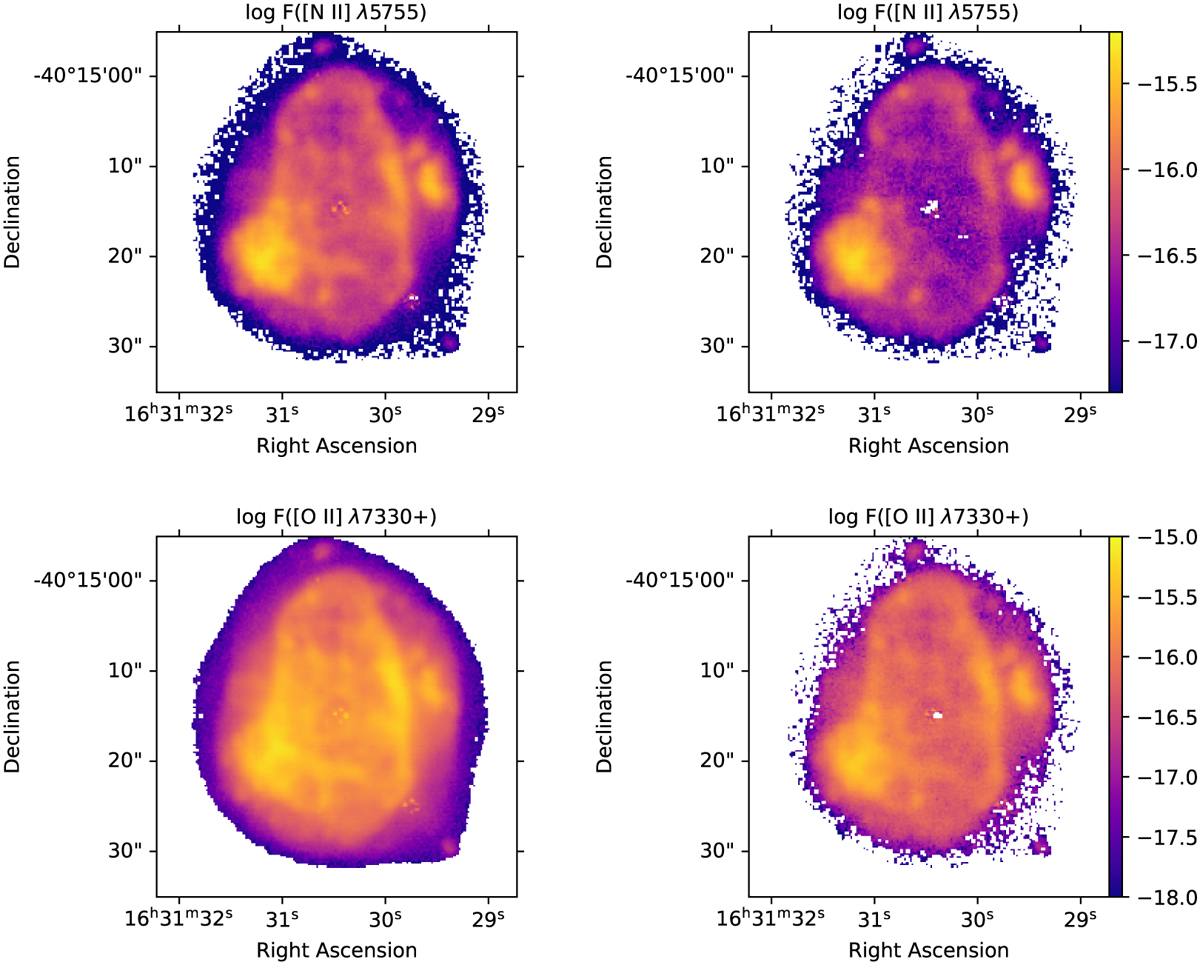
Emission maps of the two auroral lines [N II] λ 5755 (upper panels) and [O II] λ 7330+ (lower panels), without and with correction from recombination (left and right panels, respectively). The correction is obtained using Eqs. (2) and (1), adopting Te = 6000 K and ne = 10 000 cm3. The flux is expressed in units of erg cm2s_1 Å−1 and in logarithmic scale.
Current usage metrics show cumulative count of Article Views (full-text article views including HTML views, PDF and ePub downloads, according to the available data) and Abstracts Views on Vision4Press platform.
Data correspond to usage on the plateform after 2015. The current usage metrics is available 48-96 hours after online publication and is updated daily on week days.
Initial download of the metrics may take a while.