Fig. C.1
Download original image
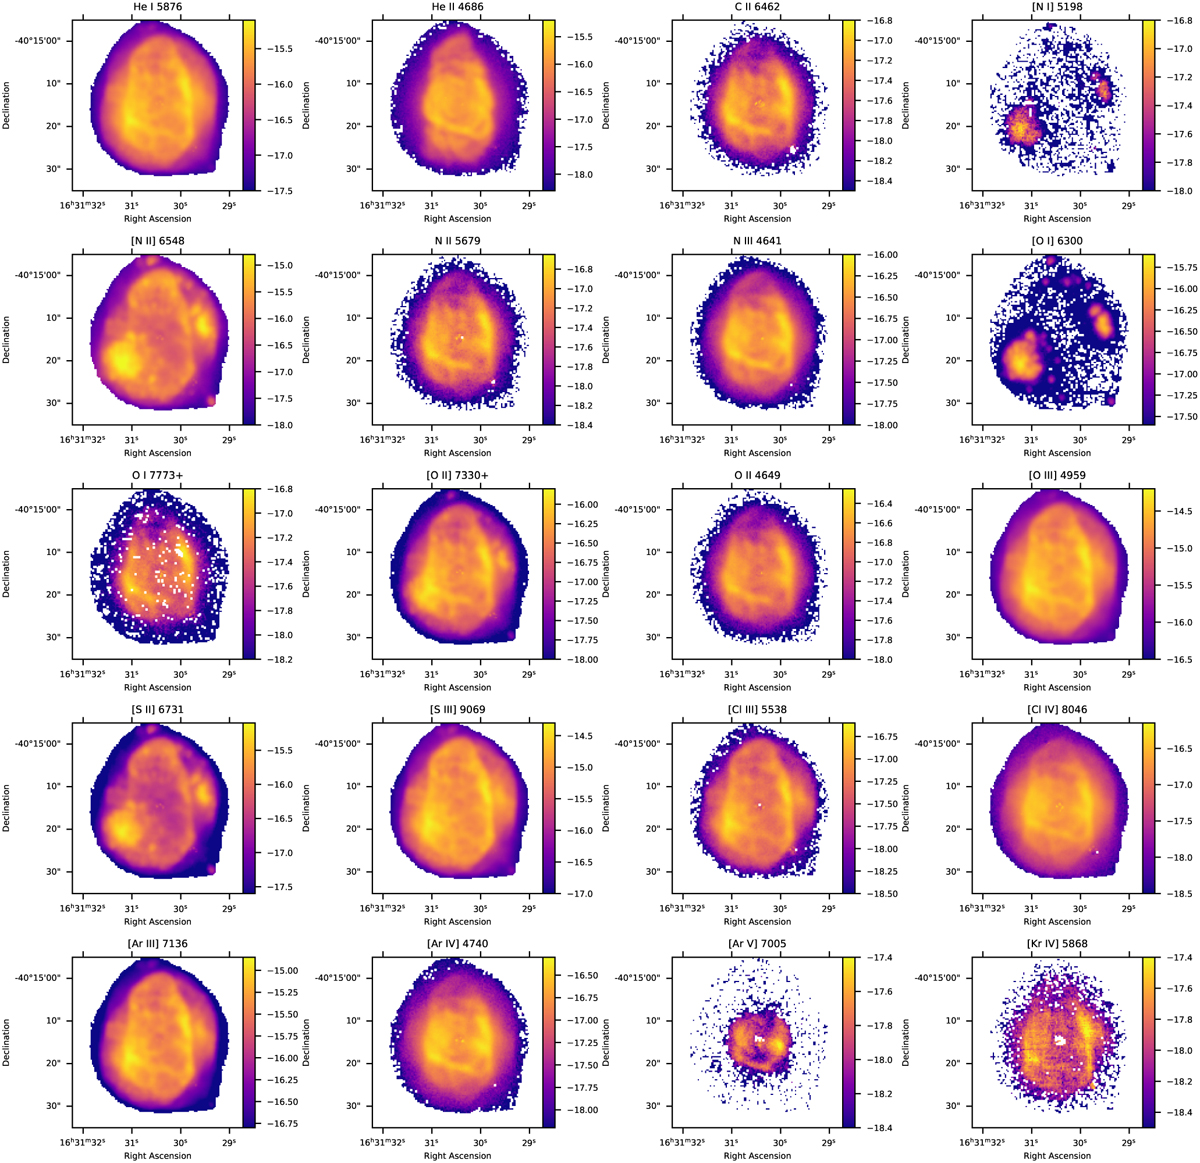
Flux maps of the observed emission lines of eight elements (heavier than H) in different ionisation states. The data were obtained from the MUSE datacube of NGC 6153. The flux is in units of erg cm−2s−1 Å−1 and the maps are classified by the atomic mass and the ionisation potential of the ion. We do not show here the special case of the auroral line [N II] λ 5755 which is contaminated by recombination and is discussed in more detail in Sect 4.3.
Current usage metrics show cumulative count of Article Views (full-text article views including HTML views, PDF and ePub downloads, according to the available data) and Abstracts Views on Vision4Press platform.
Data correspond to usage on the plateform after 2015. The current usage metrics is available 48-96 hours after online publication and is updated daily on week days.
Initial download of the metrics may take a while.