Fig. 9
Download original image
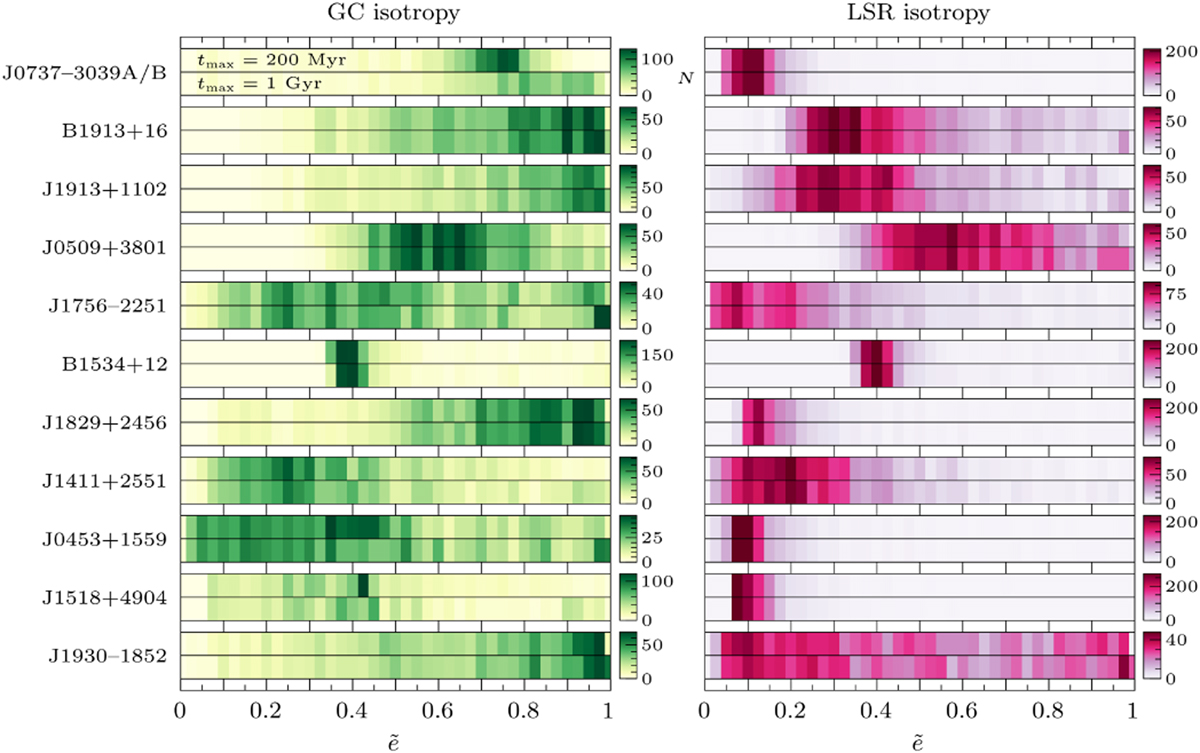
Eccentricities of the Galactic orbits of the BNSs determined by applying Eq. (6) to the Monte Carlo estimated orbits of each binary, assuming either GC isotropy (left panel) or LSR isotropy (right panel), and shown in 2D histograms with ẽ bins of 0.025. For each BNS, we computed ẽ for the trajectories integrated back up to tmax = 200 Myr (as shown in Fig. 8), and also for the trajectories with tmax = 1 Gyr (as used in Sect. 2.2), and compare both ẽ-distributions (tmax = 200 Myr first, and then tmax = 1 Gyr below).
Current usage metrics show cumulative count of Article Views (full-text article views including HTML views, PDF and ePub downloads, according to the available data) and Abstracts Views on Vision4Press platform.
Data correspond to usage on the plateform after 2015. The current usage metrics is available 48-96 hours after online publication and is updated daily on week days.
Initial download of the metrics may take a while.