Fig. 7
Download original image
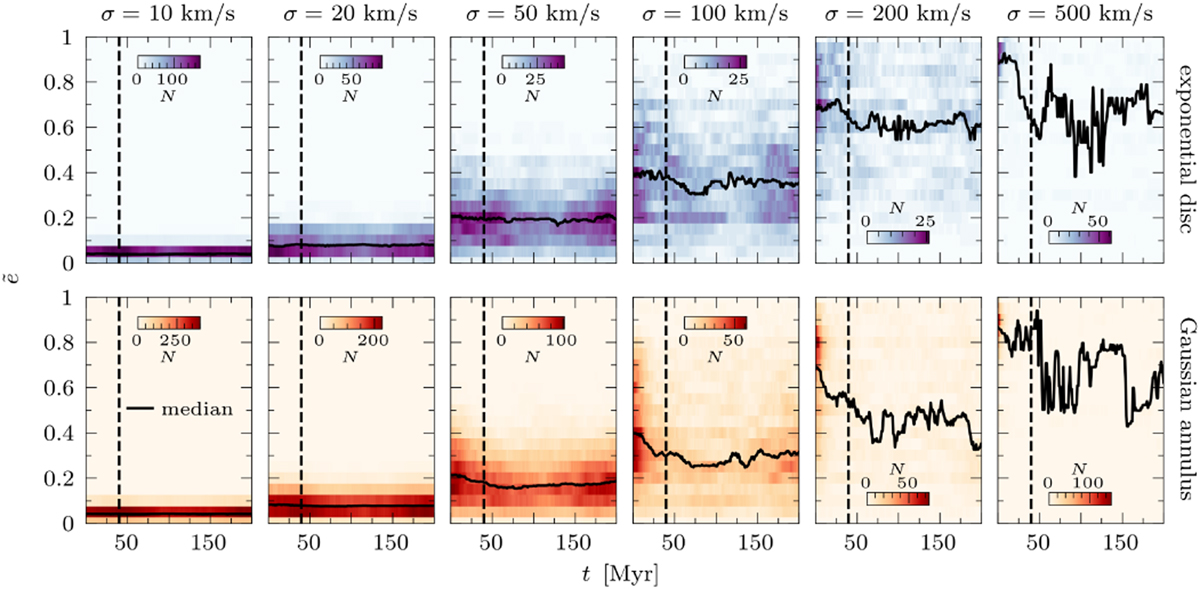
Evolution of the eccentricities (ẽ, Eq. (6)) of the objects in the solar neighbourhood, for the different Maxwellian kick distributions (σ = 10, 20, 50, 100, 200, and 500 km/s, for each column), shown in 2D histograms with eccentricity bins of 0.05 and time bins of 1 Myr. The top row shows the results using the exponential disc prior, while the bottom row shows the results using the Gaussian annulus prior. The black dashed lines show t = 40 Myr, approximating the timescale after which the median velocities have been decelerated (as shown in Fig. 5). Similar to Fig. 4, we note that the colour-scale differs for each panel, because the number of objects in the solar neighbourhood differs for each kick distribution.
Current usage metrics show cumulative count of Article Views (full-text article views including HTML views, PDF and ePub downloads, according to the available data) and Abstracts Views on Vision4Press platform.
Data correspond to usage on the plateform after 2015. The current usage metrics is available 48-96 hours after online publication and is updated daily on week days.
Initial download of the metrics may take a while.