Fig. 6
Download original image
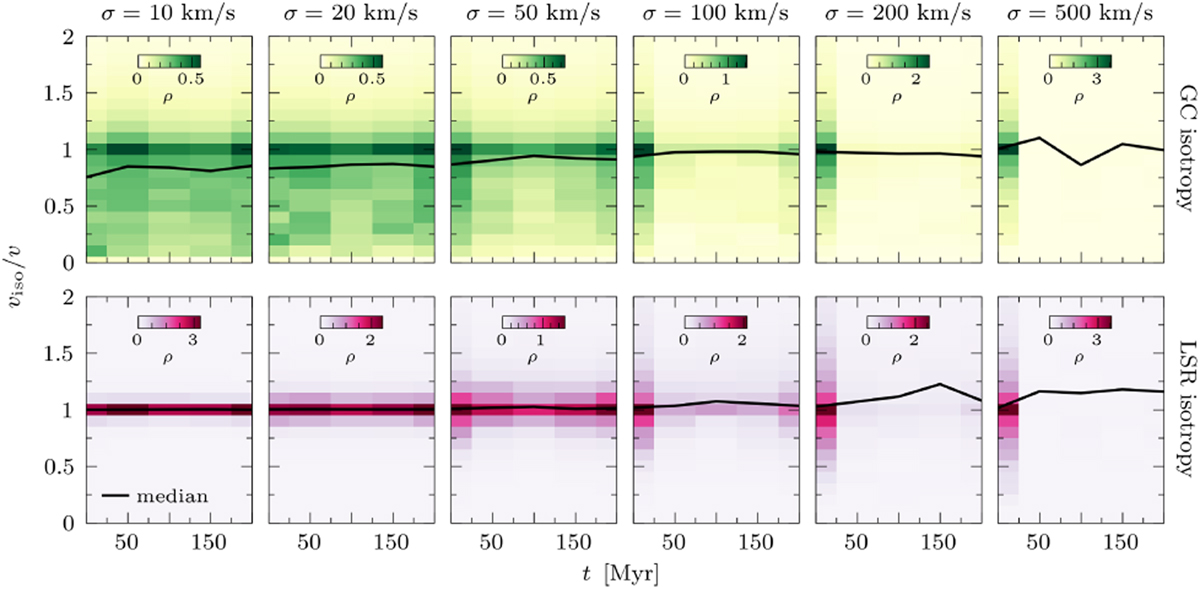
Accuracy of the velocity distributions determined through isotropy assumptions (viso) for the objects in our simulation using the Gaussian annulus prior (of which the speeds are shown in Fig. 4) that are in the solar neighbourhood at a certain point in time. This accuracy is estimated by dividing these distributions by the actual speeds (v) and evaluating viso/v every 50 Myr, for GC isotropy (top row, through Eq. (3)) and LSR isotropy (bottom row, through Eq. (4)), and for Maxwellian kick distributions with different values of σ (columns), shown in normalised 2D histogram with viso/v bins of 0.1 and time bins of 50 Myr, in units of (500 Myr)–1. The black lines show the medians of the distributions.
Current usage metrics show cumulative count of Article Views (full-text article views including HTML views, PDF and ePub downloads, according to the available data) and Abstracts Views on Vision4Press platform.
Data correspond to usage on the plateform after 2015. The current usage metrics is available 48-96 hours after online publication and is updated daily on week days.
Initial download of the metrics may take a while.